Bahamian vs Dutch Median Male Earnings
COMPARE
Bahamian
Dutch
Median Male Earnings
Median Male Earnings Comparison
Bahamians
Dutch
$44,756
MEDIAN MALE EARNINGS
0.0/ 100
METRIC RATING
332nd/ 347
METRIC RANK
$54,410
MEDIAN MALE EARNINGS
48.0/ 100
METRIC RATING
175th/ 347
METRIC RANK
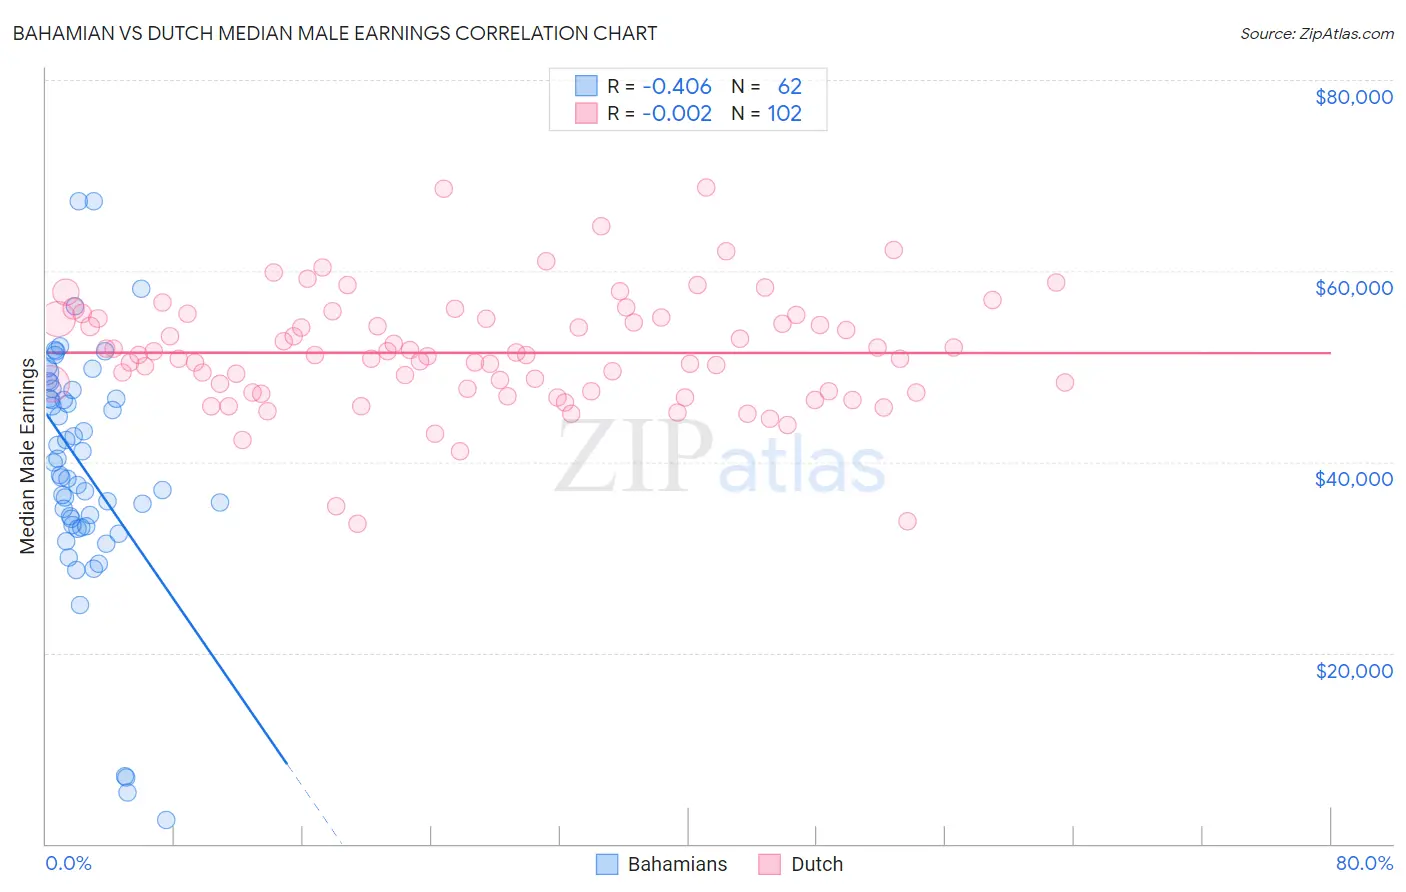
Bahamian vs Dutch Median Male Earnings Correlation Chart
The statistical analysis conducted on geographies consisting of 112,679,918 people shows a moderate negative correlation between the proportion of Bahamians and median male earnings in the United States with a correlation coefficient (R) of -0.406 and weighted average of $44,756. Similarly, the statistical analysis conducted on geographies consisting of 553,393,301 people shows no correlation between the proportion of Dutch and median male earnings in the United States with a correlation coefficient (R) of -0.002 and weighted average of $54,410, a difference of 21.6%.
Median Male Earnings Correlation Summary
| Measurement | Bahamian | Dutch |
| Minimum | $2,499 | $33,485 |
| Maximum | $67,317 | $68,738 |
| Range | $64,818 | $35,252 |
| Mean | $39,425 | $51,429 |
| Median | $39,316 | $51,206 |
| Interquartile 25% (IQ1) | $33,442 | $47,383 |
| Interquartile 75% (IQ3) | $47,537 | $55,055 |
| Interquartile Range (IQR) | $14,095 | $7,672 |
| Standard Deviation (Sample) | $12,607 | $6,107 |
| Standard Deviation (Population) | $12,505 | $6,077 |
Similar Demographics by Median Male Earnings
Demographics Similar to Bahamians by Median Male Earnings
In terms of median male earnings, the demographic groups most similar to Bahamians are Native/Alaskan ($44,775, a difference of 0.040%), Immigrants from Mexico ($44,960, a difference of 0.46%), Yakama ($45,002, a difference of 0.55%), Kiowa ($45,094, a difference of 0.76%), and Immigrants from Bahamas ($45,176, a difference of 0.94%).
| Demographics | Rating | Rank | Median Male Earnings |
| Yuman | 0.0 /100 | #325 | Tragic $45,446 |
| Immigrants | Haiti | 0.0 /100 | #326 | Tragic $45,266 |
| Immigrants | Bahamas | 0.0 /100 | #327 | Tragic $45,176 |
| Kiowa | 0.0 /100 | #328 | Tragic $45,094 |
| Yakama | 0.0 /100 | #329 | Tragic $45,002 |
| Immigrants | Mexico | 0.0 /100 | #330 | Tragic $44,960 |
| Natives/Alaskans | 0.0 /100 | #331 | Tragic $44,775 |
| Bahamians | 0.0 /100 | #332 | Tragic $44,756 |
| Immigrants | Congo | 0.0 /100 | #333 | Tragic $44,204 |
| Immigrants | Yemen | 0.0 /100 | #334 | Tragic $44,083 |
| Spanish American Indians | 0.0 /100 | #335 | Tragic $44,010 |
| Immigrants | Cuba | 0.0 /100 | #336 | Tragic $43,461 |
| Menominee | 0.0 /100 | #337 | Tragic $42,581 |
| Crow | 0.0 /100 | #338 | Tragic $42,434 |
| Pima | 0.0 /100 | #339 | Tragic $42,357 |
Demographics Similar to Dutch by Median Male Earnings
In terms of median male earnings, the demographic groups most similar to Dutch are Spaniard ($54,401, a difference of 0.020%), South American ($54,492, a difference of 0.15%), South American Indian ($54,508, a difference of 0.18%), Costa Rican ($54,279, a difference of 0.24%), and Sierra Leonean ($54,279, a difference of 0.24%).
| Demographics | Rating | Rank | Median Male Earnings |
| Immigrants | Vietnam | 60.2 /100 | #168 | Good $54,913 |
| French Canadians | 55.6 /100 | #169 | Average $54,722 |
| Finns | 55.6 /100 | #170 | Average $54,721 |
| Immigrants | Peru | 54.9 /100 | #171 | Average $54,695 |
| Welsh | 53.8 /100 | #172 | Average $54,647 |
| South American Indians | 50.4 /100 | #173 | Average $54,508 |
| South Americans | 50.0 /100 | #174 | Average $54,492 |
| Dutch | 48.0 /100 | #175 | Average $54,410 |
| Spaniards | 47.8 /100 | #176 | Average $54,401 |
| Costa Ricans | 44.8 /100 | #177 | Average $54,279 |
| Sierra Leoneans | 44.8 /100 | #178 | Average $54,279 |
| Celtics | 43.9 /100 | #179 | Average $54,242 |
| Iraqis | 42.5 /100 | #180 | Average $54,182 |
| Immigrants | Immigrants | 42.1 /100 | #181 | Average $54,168 |
| Yugoslavians | 37.4 /100 | #182 | Fair $53,967 |