Bahamian vs Immigrants from Kazakhstan Median Male Earnings
COMPARE
Bahamian
Immigrants from Kazakhstan
Median Male Earnings
Median Male Earnings Comparison
Bahamians
Immigrants from Kazakhstan
$44,756
MEDIAN MALE EARNINGS
0.0/ 100
METRIC RATING
332nd/ 347
METRIC RANK
$59,278
MEDIAN MALE EARNINGS
99.1/ 100
METRIC RATING
92nd/ 347
METRIC RANK
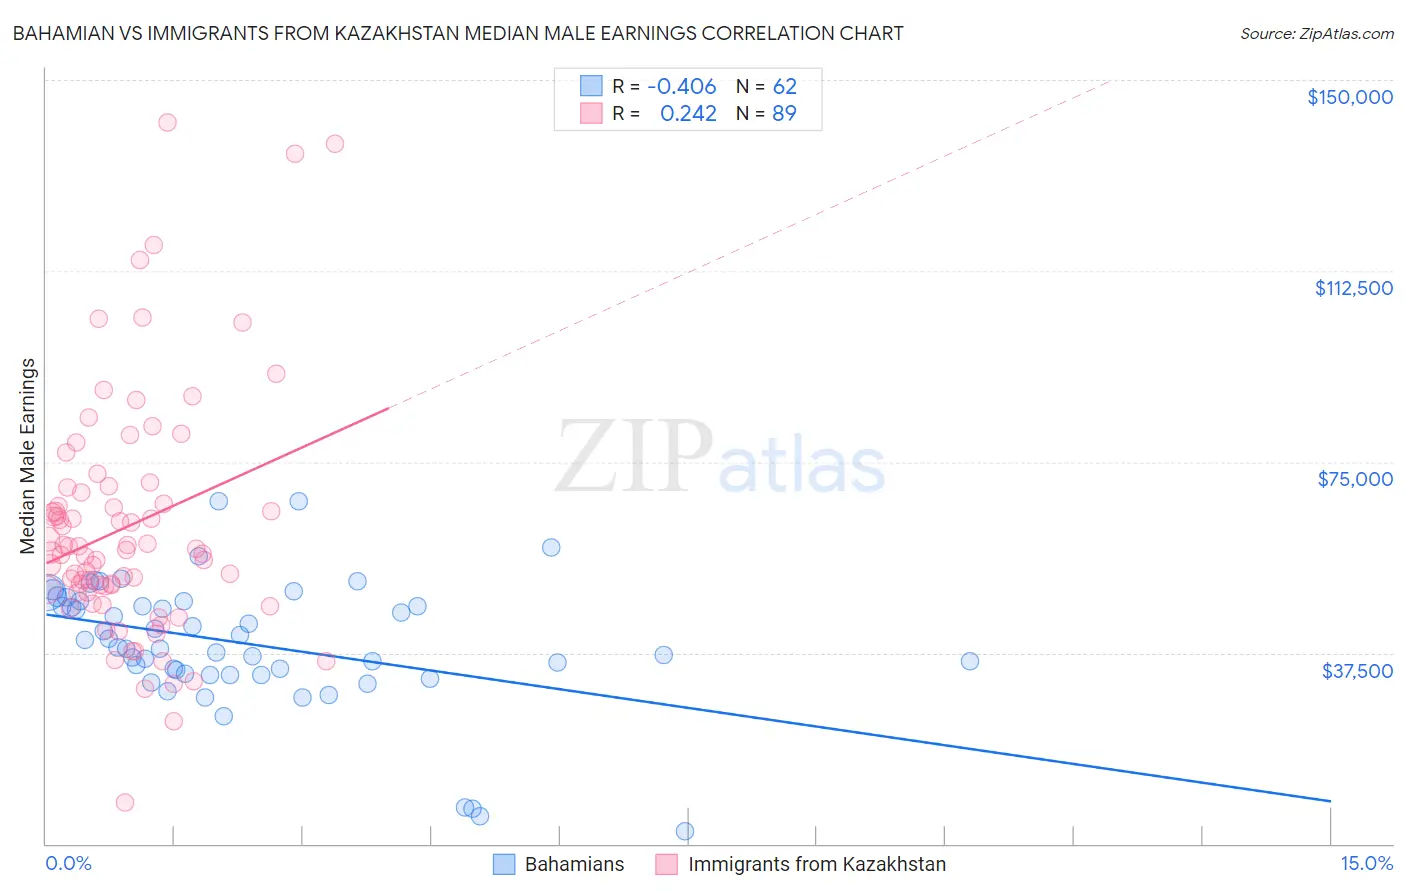
Bahamian vs Immigrants from Kazakhstan Median Male Earnings Correlation Chart
The statistical analysis conducted on geographies consisting of 112,679,918 people shows a moderate negative correlation between the proportion of Bahamians and median male earnings in the United States with a correlation coefficient (R) of -0.406 and weighted average of $44,756. Similarly, the statistical analysis conducted on geographies consisting of 124,430,044 people shows a weak positive correlation between the proportion of Immigrants from Kazakhstan and median male earnings in the United States with a correlation coefficient (R) of 0.242 and weighted average of $59,278, a difference of 32.5%.
Median Male Earnings Correlation Summary
| Measurement | Bahamian | Immigrants from Kazakhstan |
| Minimum | $2,499 | $8,214 |
| Maximum | $67,317 | $141,534 |
| Range | $64,818 | $133,320 |
| Mean | $39,425 | $62,279 |
| Median | $39,316 | $57,775 |
| Interquartile 25% (IQ1) | $33,442 | $49,614 |
| Interquartile 75% (IQ3) | $47,537 | $69,378 |
| Interquartile Range (IQR) | $14,095 | $19,764 |
| Standard Deviation (Sample) | $12,607 | $23,727 |
| Standard Deviation (Population) | $12,505 | $23,593 |
Similar Demographics by Median Male Earnings
Demographics Similar to Bahamians by Median Male Earnings
In terms of median male earnings, the demographic groups most similar to Bahamians are Native/Alaskan ($44,775, a difference of 0.040%), Immigrants from Mexico ($44,960, a difference of 0.46%), Yakama ($45,002, a difference of 0.55%), Kiowa ($45,094, a difference of 0.76%), and Immigrants from Bahamas ($45,176, a difference of 0.94%).
| Demographics | Rating | Rank | Median Male Earnings |
| Yuman | 0.0 /100 | #325 | Tragic $45,446 |
| Immigrants | Haiti | 0.0 /100 | #326 | Tragic $45,266 |
| Immigrants | Bahamas | 0.0 /100 | #327 | Tragic $45,176 |
| Kiowa | 0.0 /100 | #328 | Tragic $45,094 |
| Yakama | 0.0 /100 | #329 | Tragic $45,002 |
| Immigrants | Mexico | 0.0 /100 | #330 | Tragic $44,960 |
| Natives/Alaskans | 0.0 /100 | #331 | Tragic $44,775 |
| Bahamians | 0.0 /100 | #332 | Tragic $44,756 |
| Immigrants | Congo | 0.0 /100 | #333 | Tragic $44,204 |
| Immigrants | Yemen | 0.0 /100 | #334 | Tragic $44,083 |
| Spanish American Indians | 0.0 /100 | #335 | Tragic $44,010 |
| Immigrants | Cuba | 0.0 /100 | #336 | Tragic $43,461 |
| Menominee | 0.0 /100 | #337 | Tragic $42,581 |
| Crow | 0.0 /100 | #338 | Tragic $42,434 |
| Pima | 0.0 /100 | #339 | Tragic $42,357 |
Demographics Similar to Immigrants from Kazakhstan by Median Male Earnings
In terms of median male earnings, the demographic groups most similar to Immigrants from Kazakhstan are Immigrants from Southern Europe ($59,217, a difference of 0.10%), Laotian ($59,351, a difference of 0.12%), Austrian ($59,359, a difference of 0.14%), Immigrants from North Macedonia ($59,189, a difference of 0.15%), and Immigrants from Moldova ($59,417, a difference of 0.24%).
| Demographics | Rating | Rank | Median Male Earnings |
| Italians | 99.3 /100 | #85 | Exceptional $59,551 |
| Immigrants | England | 99.3 /100 | #86 | Exceptional $59,527 |
| Macedonians | 99.3 /100 | #87 | Exceptional $59,522 |
| Immigrants | Argentina | 99.3 /100 | #88 | Exceptional $59,491 |
| Immigrants | Moldova | 99.2 /100 | #89 | Exceptional $59,417 |
| Austrians | 99.2 /100 | #90 | Exceptional $59,359 |
| Laotians | 99.2 /100 | #91 | Exceptional $59,351 |
| Immigrants | Kazakhstan | 99.1 /100 | #92 | Exceptional $59,278 |
| Immigrants | Southern Europe | 99.0 /100 | #93 | Exceptional $59,217 |
| Immigrants | North Macedonia | 99.0 /100 | #94 | Exceptional $59,189 |
| Immigrants | Lebanon | 98.6 /100 | #95 | Exceptional $58,835 |
| Albanians | 98.4 /100 | #96 | Exceptional $58,680 |
| Northern Europeans | 98.2 /100 | #97 | Exceptional $58,588 |
| Jordanians | 98.1 /100 | #98 | Exceptional $58,500 |
| Immigrants | Poland | 98.0 /100 | #99 | Exceptional $58,452 |