Bahamian vs Immigrants from Lithuania Disability Age 65 to 74
COMPARE
Bahamian
Immigrants from Lithuania
Disability Age 65 to 74
Disability Age 65 to 74 Comparison
Bahamians
Immigrants from Lithuania
24.4%
DISABILITY AGE 65 TO 74
4.5/ 100
METRIC RATING
233rd/ 347
METRIC RANK
20.5%
DISABILITY AGE 65 TO 74
100.0/ 100
METRIC RATING
16th/ 347
METRIC RANK
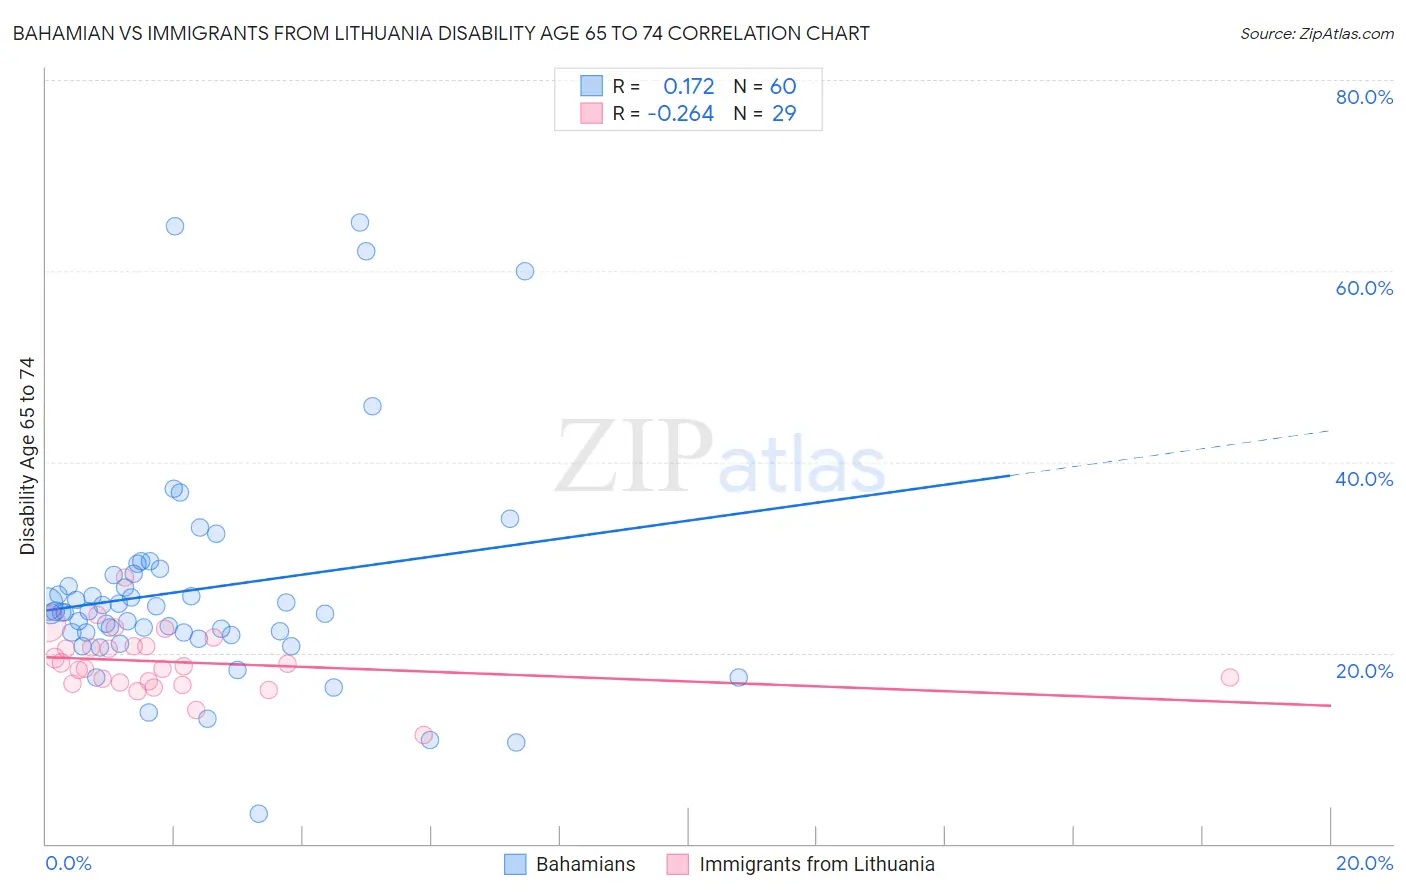
Bahamian vs Immigrants from Lithuania Disability Age 65 to 74 Correlation Chart
The statistical analysis conducted on geographies consisting of 112,540,799 people shows a poor positive correlation between the proportion of Bahamians and percentage of population with a disability between the ages 65 and 75 in the United States with a correlation coefficient (R) of 0.172 and weighted average of 24.4%. Similarly, the statistical analysis conducted on geographies consisting of 117,698,011 people shows a weak negative correlation between the proportion of Immigrants from Lithuania and percentage of population with a disability between the ages 65 and 75 in the United States with a correlation coefficient (R) of -0.264 and weighted average of 20.5%, a difference of 18.6%.
Disability Age 65 to 74 Correlation Summary
| Measurement | Bahamian | Immigrants from Lithuania |
| Minimum | 3.1% | 11.4% |
| Maximum | 65.1% | 27.8% |
| Range | 61.9% | 16.5% |
| Mean | 26.6% | 19.0% |
| Median | 24.3% | 18.6% |
| Interquartile 25% (IQ1) | 22.0% | 16.8% |
| Interquartile 75% (IQ3) | 28.2% | 20.7% |
| Interquartile Range (IQR) | 6.2% | 3.8% |
| Standard Deviation (Sample) | 11.8% | 3.3% |
| Standard Deviation (Population) | 11.7% | 3.2% |
Similar Demographics by Disability Age 65 to 74
Demographics Similar to Bahamians by Disability Age 65 to 74
In terms of disability age 65 to 74, the demographic groups most similar to Bahamians are Panamanian (24.4%, a difference of 0.11%), Immigrants from Zaire (24.3%, a difference of 0.16%), Immigrants from Thailand (24.3%, a difference of 0.21%), Scotch-Irish (24.4%, a difference of 0.26%), and German Russian (24.4%, a difference of 0.30%).
| Demographics | Rating | Rank | Disability Age 65 to 74 |
| Iraqis | 8.1 /100 | #226 | Tragic 24.2% |
| Nigerians | 7.8 /100 | #227 | Tragic 24.2% |
| Whites/Caucasians | 6.6 /100 | #228 | Tragic 24.2% |
| Celtics | 6.4 /100 | #229 | Tragic 24.2% |
| Barbadians | 6.0 /100 | #230 | Tragic 24.3% |
| Immigrants | Thailand | 5.2 /100 | #231 | Tragic 24.3% |
| Immigrants | Zaire | 5.0 /100 | #232 | Tragic 24.3% |
| Bahamians | 4.5 /100 | #233 | Tragic 24.4% |
| Panamanians | 4.2 /100 | #234 | Tragic 24.4% |
| Scotch-Irish | 3.8 /100 | #235 | Tragic 24.4% |
| German Russians | 3.7 /100 | #236 | Tragic 24.4% |
| West Indians | 3.4 /100 | #237 | Tragic 24.5% |
| Immigrants | Ghana | 3.0 /100 | #238 | Tragic 24.5% |
| Immigrants | Caribbean | 2.6 /100 | #239 | Tragic 24.6% |
| Spaniards | 2.4 /100 | #240 | Tragic 24.6% |
Demographics Similar to Immigrants from Lithuania by Disability Age 65 to 74
In terms of disability age 65 to 74, the demographic groups most similar to Immigrants from Lithuania are Paraguayan (20.5%, a difference of 0.060%), Indian (Asian) (20.5%, a difference of 0.080%), Immigrants from South Central Asia (20.6%, a difference of 0.25%), Eastern European (20.6%, a difference of 0.32%), and Burmese (20.6%, a difference of 0.35%).
| Demographics | Rating | Rank | Disability Age 65 to 74 |
| Immigrants | China | 100.0 /100 | #9 | Exceptional 20.3% |
| Immigrants | Eastern Asia | 100.0 /100 | #10 | Exceptional 20.3% |
| Immigrants | Ireland | 100.0 /100 | #11 | Exceptional 20.3% |
| Immigrants | Korea | 100.0 /100 | #12 | Exceptional 20.4% |
| Immigrants | Singapore | 100.0 /100 | #13 | Exceptional 20.4% |
| Indians (Asian) | 100.0 /100 | #14 | Exceptional 20.5% |
| Paraguayans | 100.0 /100 | #15 | Exceptional 20.5% |
| Immigrants | Lithuania | 100.0 /100 | #16 | Exceptional 20.5% |
| Immigrants | South Central Asia | 100.0 /100 | #17 | Exceptional 20.6% |
| Eastern Europeans | 100.0 /100 | #18 | Exceptional 20.6% |
| Burmese | 100.0 /100 | #19 | Exceptional 20.6% |
| Okinawans | 100.0 /100 | #20 | Exceptional 20.7% |
| Immigrants | Bolivia | 99.9 /100 | #21 | Exceptional 20.8% |
| Immigrants | Iran | 99.9 /100 | #22 | Exceptional 20.9% |
| Immigrants | Belgium | 99.9 /100 | #23 | Exceptional 21.0% |