Bahamian vs Immigrants from Fiji Median Male Earnings
COMPARE
Bahamian
Immigrants from Fiji
Median Male Earnings
Median Male Earnings Comparison
Bahamians
Immigrants from Fiji
$44,756
MEDIAN MALE EARNINGS
0.0/ 100
METRIC RATING
332nd/ 347
METRIC RANK
$54,958
MEDIAN MALE EARNINGS
61.2/ 100
METRIC RATING
167th/ 347
METRIC RANK
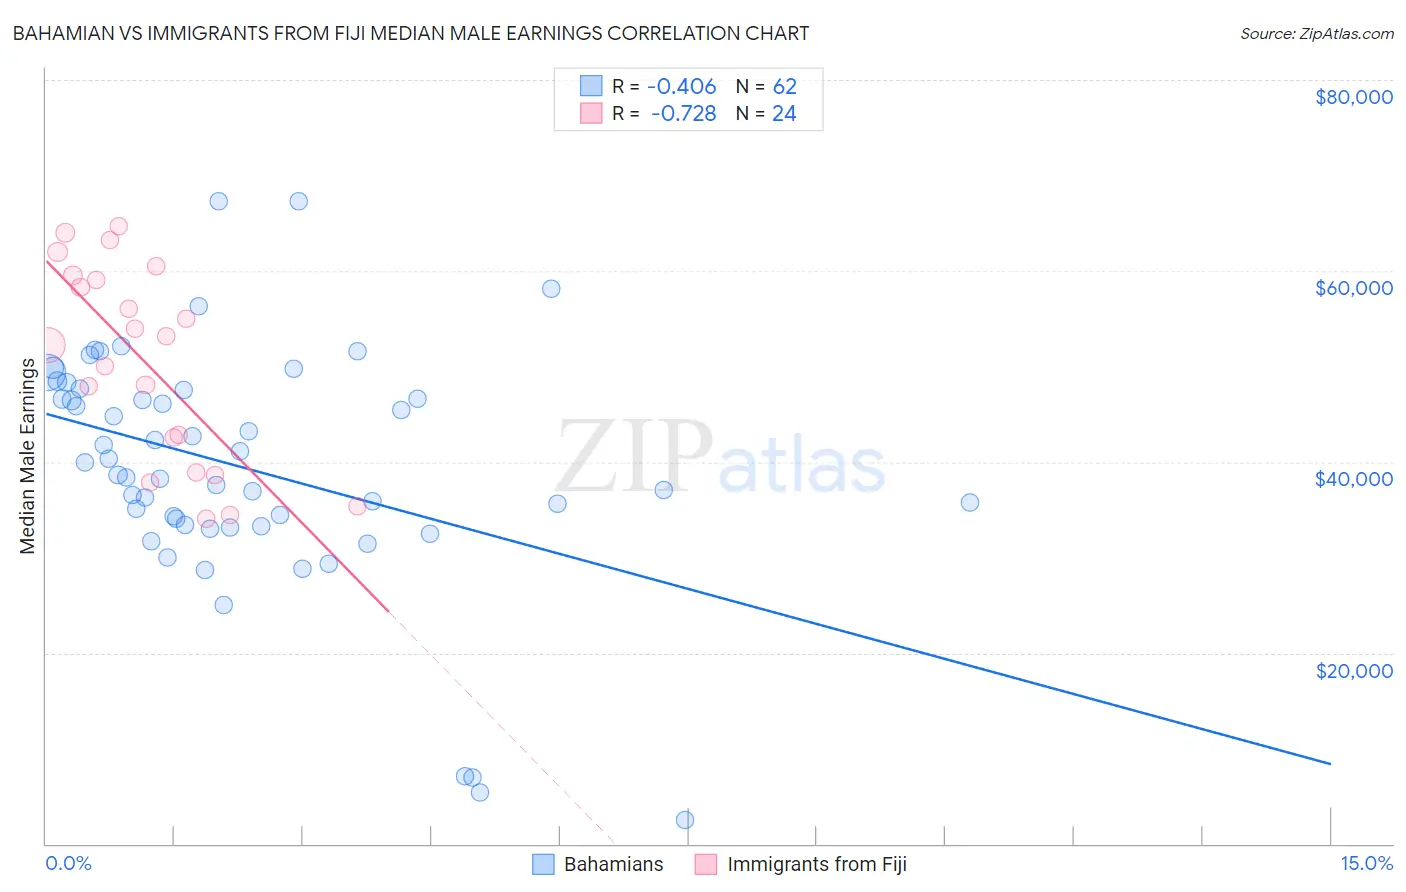
Bahamian vs Immigrants from Fiji Median Male Earnings Correlation Chart
The statistical analysis conducted on geographies consisting of 112,679,918 people shows a moderate negative correlation between the proportion of Bahamians and median male earnings in the United States with a correlation coefficient (R) of -0.406 and weighted average of $44,756. Similarly, the statistical analysis conducted on geographies consisting of 93,749,619 people shows a strong negative correlation between the proportion of Immigrants from Fiji and median male earnings in the United States with a correlation coefficient (R) of -0.728 and weighted average of $54,958, a difference of 22.8%.
Median Male Earnings Correlation Summary
| Measurement | Bahamian | Immigrants from Fiji |
| Minimum | $2,499 | $34,054 |
| Maximum | $67,317 | $64,713 |
| Range | $64,818 | $30,659 |
| Mean | $39,425 | $50,520 |
| Median | $39,316 | $52,738 |
| Interquartile 25% (IQ1) | $33,442 | $40,707 |
| Interquartile 75% (IQ3) | $47,537 | $59,322 |
| Interquartile Range (IQR) | $14,095 | $18,615 |
| Standard Deviation (Sample) | $12,607 | $10,211 |
| Standard Deviation (Population) | $12,505 | $9,996 |
Similar Demographics by Median Male Earnings
Demographics Similar to Bahamians by Median Male Earnings
In terms of median male earnings, the demographic groups most similar to Bahamians are Native/Alaskan ($44,775, a difference of 0.040%), Immigrants from Mexico ($44,960, a difference of 0.46%), Yakama ($45,002, a difference of 0.55%), Kiowa ($45,094, a difference of 0.76%), and Immigrants from Bahamas ($45,176, a difference of 0.94%).
| Demographics | Rating | Rank | Median Male Earnings |
| Yuman | 0.0 /100 | #325 | Tragic $45,446 |
| Immigrants | Haiti | 0.0 /100 | #326 | Tragic $45,266 |
| Immigrants | Bahamas | 0.0 /100 | #327 | Tragic $45,176 |
| Kiowa | 0.0 /100 | #328 | Tragic $45,094 |
| Yakama | 0.0 /100 | #329 | Tragic $45,002 |
| Immigrants | Mexico | 0.0 /100 | #330 | Tragic $44,960 |
| Natives/Alaskans | 0.0 /100 | #331 | Tragic $44,775 |
| Bahamians | 0.0 /100 | #332 | Tragic $44,756 |
| Immigrants | Congo | 0.0 /100 | #333 | Tragic $44,204 |
| Immigrants | Yemen | 0.0 /100 | #334 | Tragic $44,083 |
| Spanish American Indians | 0.0 /100 | #335 | Tragic $44,010 |
| Immigrants | Cuba | 0.0 /100 | #336 | Tragic $43,461 |
| Menominee | 0.0 /100 | #337 | Tragic $42,581 |
| Crow | 0.0 /100 | #338 | Tragic $42,434 |
| Pima | 0.0 /100 | #339 | Tragic $42,357 |
Demographics Similar to Immigrants from Fiji by Median Male Earnings
In terms of median male earnings, the demographic groups most similar to Immigrants from Fiji are German ($54,974, a difference of 0.030%), Immigrants from Vietnam ($54,913, a difference of 0.080%), Immigrants from Portugal ($55,182, a difference of 0.41%), French Canadian ($54,722, a difference of 0.43%), and Finnish ($54,721, a difference of 0.43%).
| Demographics | Rating | Rank | Median Male Earnings |
| Basques | 70.3 /100 | #160 | Good $55,370 |
| Belgians | 70.1 /100 | #161 | Good $55,361 |
| French | 69.9 /100 | #162 | Good $55,350 |
| Ugandans | 68.6 /100 | #163 | Good $55,290 |
| Immigrants | South Eastern Asia | 67.6 /100 | #164 | Good $55,241 |
| Immigrants | Portugal | 66.3 /100 | #165 | Good $55,182 |
| Germans | 61.6 /100 | #166 | Good $54,974 |
| Immigrants | Fiji | 61.2 /100 | #167 | Good $54,958 |
| Immigrants | Vietnam | 60.2 /100 | #168 | Good $54,913 |
| French Canadians | 55.6 /100 | #169 | Average $54,722 |
| Finns | 55.6 /100 | #170 | Average $54,721 |
| Immigrants | Peru | 54.9 /100 | #171 | Average $54,695 |
| Welsh | 53.8 /100 | #172 | Average $54,647 |
| South American Indians | 50.4 /100 | #173 | Average $54,508 |
| South Americans | 50.0 /100 | #174 | Average $54,492 |