Austrian vs Immigrants from Ecuador Divorced or Separated
COMPARE
Austrian
Immigrants from Ecuador
Divorced or Separated
Divorced or Separated Comparison
Austrians
Immigrants from Ecuador
12.0%
DIVORCED OR SEPARATED
72.2/ 100
METRIC RATING
153rd/ 347
METRIC RANK
11.8%
DIVORCED OR SEPARATED
88.9/ 100
METRIC RATING
128th/ 347
METRIC RANK
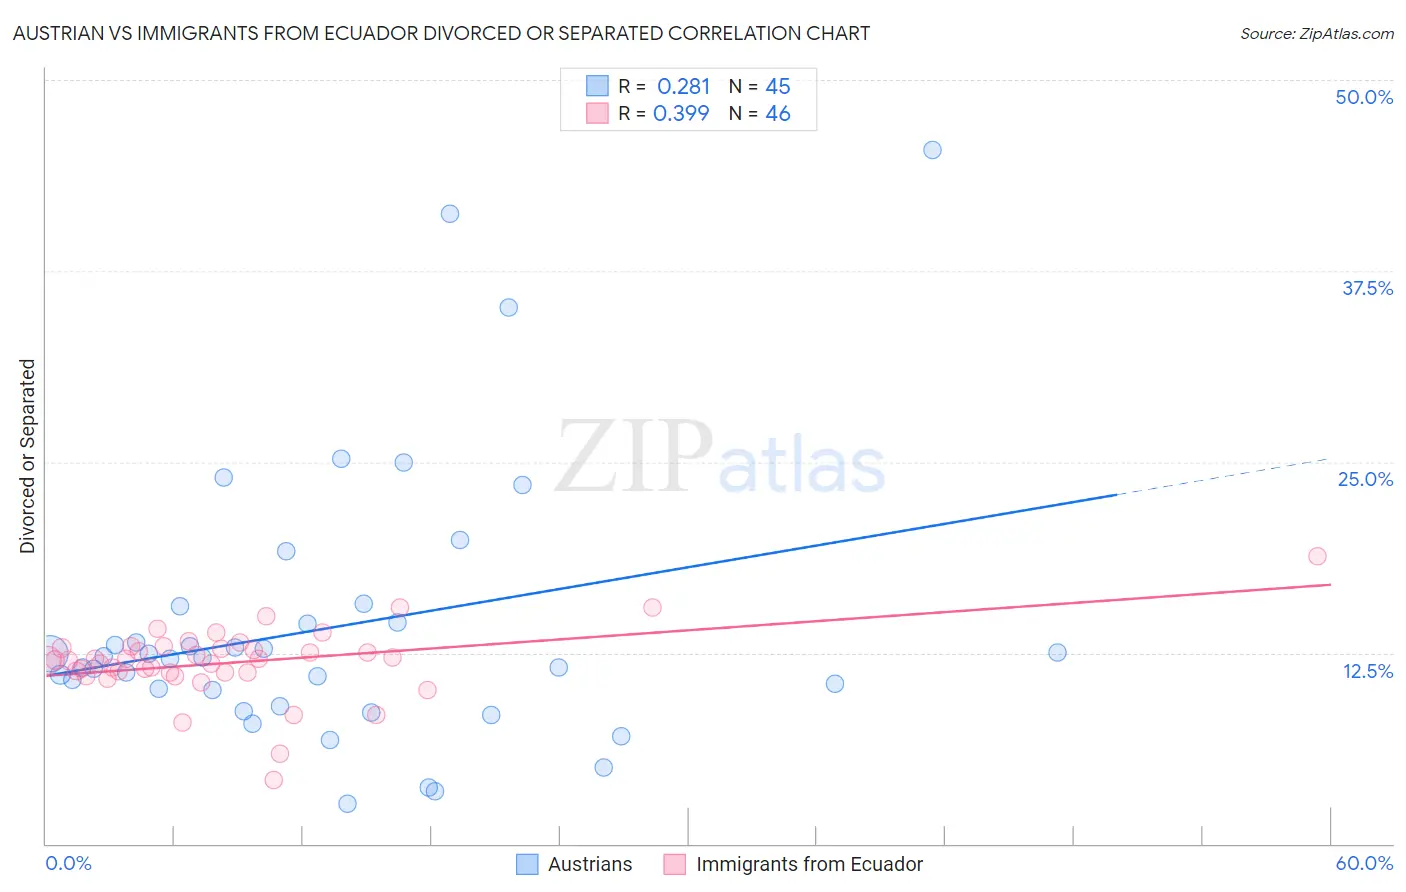
Austrian vs Immigrants from Ecuador Divorced or Separated Correlation Chart
The statistical analysis conducted on geographies consisting of 451,875,003 people shows a weak positive correlation between the proportion of Austrians and percentage of population currently divorced or separated in the United States with a correlation coefficient (R) of 0.281 and weighted average of 12.0%. Similarly, the statistical analysis conducted on geographies consisting of 270,954,904 people shows a mild positive correlation between the proportion of Immigrants from Ecuador and percentage of population currently divorced or separated in the United States with a correlation coefficient (R) of 0.399 and weighted average of 11.8%, a difference of 0.99%.
Divorced or Separated Correlation Summary
| Measurement | Austrian | Immigrants from Ecuador |
| Minimum | 2.6% | 4.2% |
| Maximum | 45.4% | 18.8% |
| Range | 42.8% | 14.6% |
| Mean | 14.2% | 11.9% |
| Median | 12.2% | 12.0% |
| Interquartile 25% (IQ1) | 9.5% | 11.2% |
| Interquartile 75% (IQ3) | 15.0% | 12.8% |
| Interquartile Range (IQR) | 5.5% | 1.6% |
| Standard Deviation (Sample) | 8.9% | 2.4% |
| Standard Deviation (Population) | 8.8% | 2.3% |
Similar Demographics by Divorced or Separated
Demographics Similar to Austrians by Divorced or Separated
In terms of divorced or separated, the demographic groups most similar to Austrians are Chilean (12.0%, a difference of 0.040%), Japanese (12.0%, a difference of 0.060%), Immigrants from Hungary (11.9%, a difference of 0.070%), Hungarian (12.0%, a difference of 0.080%), and Immigrants from Brazil (12.0%, a difference of 0.14%).
| Demographics | Rating | Rank | Divorced or Separated |
| Immigrants | Grenada | 79.1 /100 | #146 | Good 11.9% |
| Poles | 78.6 /100 | #147 | Good 11.9% |
| Italians | 77.8 /100 | #148 | Good 11.9% |
| Immigrants | Oceania | 77.7 /100 | #149 | Good 11.9% |
| Immigrants | Portugal | 77.3 /100 | #150 | Good 11.9% |
| Czechs | 76.4 /100 | #151 | Good 11.9% |
| Immigrants | Hungary | 73.7 /100 | #152 | Good 11.9% |
| Austrians | 72.2 /100 | #153 | Good 12.0% |
| Chileans | 71.3 /100 | #154 | Good 12.0% |
| Japanese | 70.9 /100 | #155 | Good 12.0% |
| Hungarians | 70.3 /100 | #156 | Good 12.0% |
| Immigrants | Brazil | 68.8 /100 | #157 | Good 12.0% |
| Icelanders | 66.0 /100 | #158 | Good 12.0% |
| Immigrants | Barbados | 66.0 /100 | #159 | Good 12.0% |
| Immigrants | Scotland | 65.8 /100 | #160 | Good 12.0% |
Demographics Similar to Immigrants from Ecuador by Divorced or Separated
In terms of divorced or separated, the demographic groups most similar to Immigrants from Ecuador are South African (11.8%, a difference of 0.0%), Immigrants from St. Vincent and the Grenadines (11.8%, a difference of 0.040%), Immigrants from Austria (11.8%, a difference of 0.050%), Immigrants from Cambodia (11.8%, a difference of 0.060%), and Immigrants from Afghanistan (11.8%, a difference of 0.080%).
| Demographics | Rating | Rank | Divorced or Separated |
| Romanians | 94.5 /100 | #121 | Exceptional 11.8% |
| Menominee | 93.8 /100 | #122 | Exceptional 11.8% |
| Immigrants | Immigrants | 93.7 /100 | #123 | Exceptional 11.8% |
| Ugandans | 93.1 /100 | #124 | Exceptional 11.8% |
| Ukrainians | 92.3 /100 | #125 | Exceptional 11.8% |
| South American Indians | 92.1 /100 | #126 | Exceptional 11.8% |
| South Africans | 88.9 /100 | #127 | Excellent 11.8% |
| Immigrants | Ecuador | 88.9 /100 | #128 | Excellent 11.8% |
| Immigrants | St. Vincent and the Grenadines | 88.4 /100 | #129 | Excellent 11.8% |
| Immigrants | Austria | 88.2 /100 | #130 | Excellent 11.8% |
| Immigrants | Cambodia | 88.2 /100 | #131 | Excellent 11.8% |
| Immigrants | Afghanistan | 87.9 /100 | #132 | Excellent 11.8% |
| New Zealanders | 87.5 /100 | #133 | Excellent 11.9% |
| Argentineans | 85.1 /100 | #134 | Excellent 11.9% |
| Danes | 84.8 /100 | #135 | Excellent 11.9% |