Austrian vs Panamanian Wage/Income Gap
COMPARE
Austrian
Panamanian
Wage/Income Gap
Wage/Income Gap Comparison
Austrians
Panamanians
28.4%
WAGE/INCOME GAP
0.2/ 100
METRIC RATING
298th/ 347
METRIC RANK
24.4%
WAGE/INCOME GAP
96.5/ 100
METRIC RATING
114th/ 347
METRIC RANK
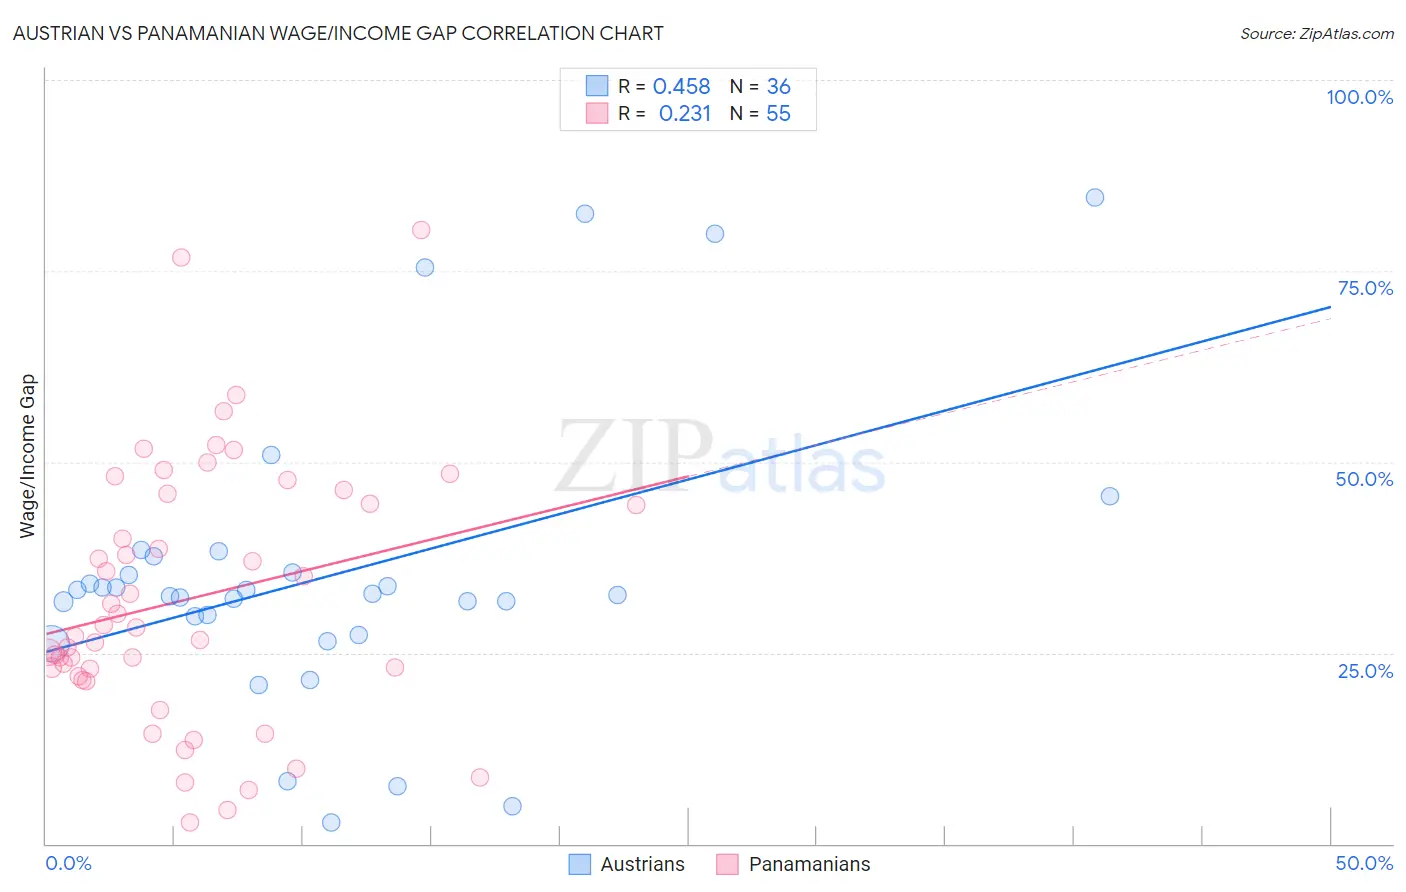
Austrian vs Panamanian Wage/Income Gap Correlation Chart
The statistical analysis conducted on geographies consisting of 451,520,484 people shows a moderate positive correlation between the proportion of Austrians and wage/income gap percentage in the United States with a correlation coefficient (R) of 0.458 and weighted average of 28.4%. Similarly, the statistical analysis conducted on geographies consisting of 281,143,702 people shows a weak positive correlation between the proportion of Panamanians and wage/income gap percentage in the United States with a correlation coefficient (R) of 0.231 and weighted average of 24.4%, a difference of 16.6%.
Wage/Income Gap Correlation Summary
| Measurement | Austrian | Panamanian |
| Minimum | 2.8% | 2.8% |
| Maximum | 84.6% | 80.4% |
| Range | 81.9% | 77.6% |
| Mean | 35.2% | 32.1% |
| Median | 32.6% | 28.3% |
| Interquartile 25% (IQ1) | 28.6% | 22.0% |
| Interquartile 75% (IQ3) | 36.7% | 45.8% |
| Interquartile Range (IQR) | 8.1% | 23.8% |
| Standard Deviation (Sample) | 19.2% | 17.0% |
| Standard Deviation (Population) | 18.9% | 16.9% |
Similar Demographics by Wage/Income Gap
Demographics Similar to Austrians by Wage/Income Gap
In terms of wage/income gap, the demographic groups most similar to Austrians are Immigrants from North America (28.4%, a difference of 0.0%), Immigrants from North Macedonia (28.4%, a difference of 0.050%), Immigrants from Northern Europe (28.5%, a difference of 0.16%), Immigrants from Canada (28.5%, a difference of 0.21%), and Scotch-Irish (28.5%, a difference of 0.24%).
| Demographics | Rating | Rank | Wage/Income Gap |
| Czechoslovakians | 0.3 /100 | #291 | Tragic 28.2% |
| Immigrants | Australia | 0.3 /100 | #292 | Tragic 28.2% |
| Immigrants | Israel | 0.3 /100 | #293 | Tragic 28.2% |
| Greeks | 0.3 /100 | #294 | Tragic 28.2% |
| Slovenes | 0.3 /100 | #295 | Tragic 28.3% |
| Northern Europeans | 0.3 /100 | #296 | Tragic 28.3% |
| Immigrants | North America | 0.2 /100 | #297 | Tragic 28.4% |
| Austrians | 0.2 /100 | #298 | Tragic 28.4% |
| Immigrants | North Macedonia | 0.2 /100 | #299 | Tragic 28.4% |
| Immigrants | Northern Europe | 0.2 /100 | #300 | Tragic 28.5% |
| Immigrants | Canada | 0.2 /100 | #301 | Tragic 28.5% |
| Scotch-Irish | 0.2 /100 | #302 | Tragic 28.5% |
| Irish | 0.2 /100 | #303 | Tragic 28.5% |
| Immigrants | Netherlands | 0.2 /100 | #304 | Tragic 28.5% |
| Immigrants | South Africa | 0.1 /100 | #305 | Tragic 28.5% |
Demographics Similar to Panamanians by Wage/Income Gap
In terms of wage/income gap, the demographic groups most similar to Panamanians are Immigrants from Kenya (24.4%, a difference of 0.060%), Sioux (24.3%, a difference of 0.20%), Alaska Native (24.4%, a difference of 0.23%), Immigrants from Colombia (24.3%, a difference of 0.25%), and Immigrants from Afghanistan (24.4%, a difference of 0.29%).
| Demographics | Rating | Rank | Wage/Income Gap |
| Yaqui | 98.4 /100 | #107 | Exceptional 24.0% |
| Immigrants | Albania | 98.4 /100 | #108 | Exceptional 24.0% |
| Ugandans | 98.3 /100 | #109 | Exceptional 24.1% |
| Immigrants | Morocco | 98.1 /100 | #110 | Exceptional 24.1% |
| Soviet Union | 97.6 /100 | #111 | Exceptional 24.2% |
| Immigrants | Colombia | 97.0 /100 | #112 | Exceptional 24.3% |
| Sioux | 96.9 /100 | #113 | Exceptional 24.3% |
| Panamanians | 96.5 /100 | #114 | Exceptional 24.4% |
| Immigrants | Kenya | 96.4 /100 | #115 | Exceptional 24.4% |
| Alaska Natives | 96.0 /100 | #116 | Exceptional 24.4% |
| Immigrants | Afghanistan | 95.9 /100 | #117 | Exceptional 24.4% |
| Immigrants | Micronesia | 95.8 /100 | #118 | Exceptional 24.4% |
| Kenyans | 95.8 /100 | #119 | Exceptional 24.5% |
| Cree | 95.6 /100 | #120 | Exceptional 24.5% |
| Immigrants | Thailand | 94.9 /100 | #121 | Exceptional 24.5% |