Australian vs Barbadian Median Household Income
COMPARE
Australian
Barbadian
Median Household Income
Median Household Income Comparison
Australians
Barbadians
$96,490
MEDIAN HOUSEHOLD INCOME
99.9/ 100
METRIC RATING
46th/ 347
METRIC RANK
$79,664
MEDIAN HOUSEHOLD INCOME
3.0/ 100
METRIC RATING
238th/ 347
METRIC RANK
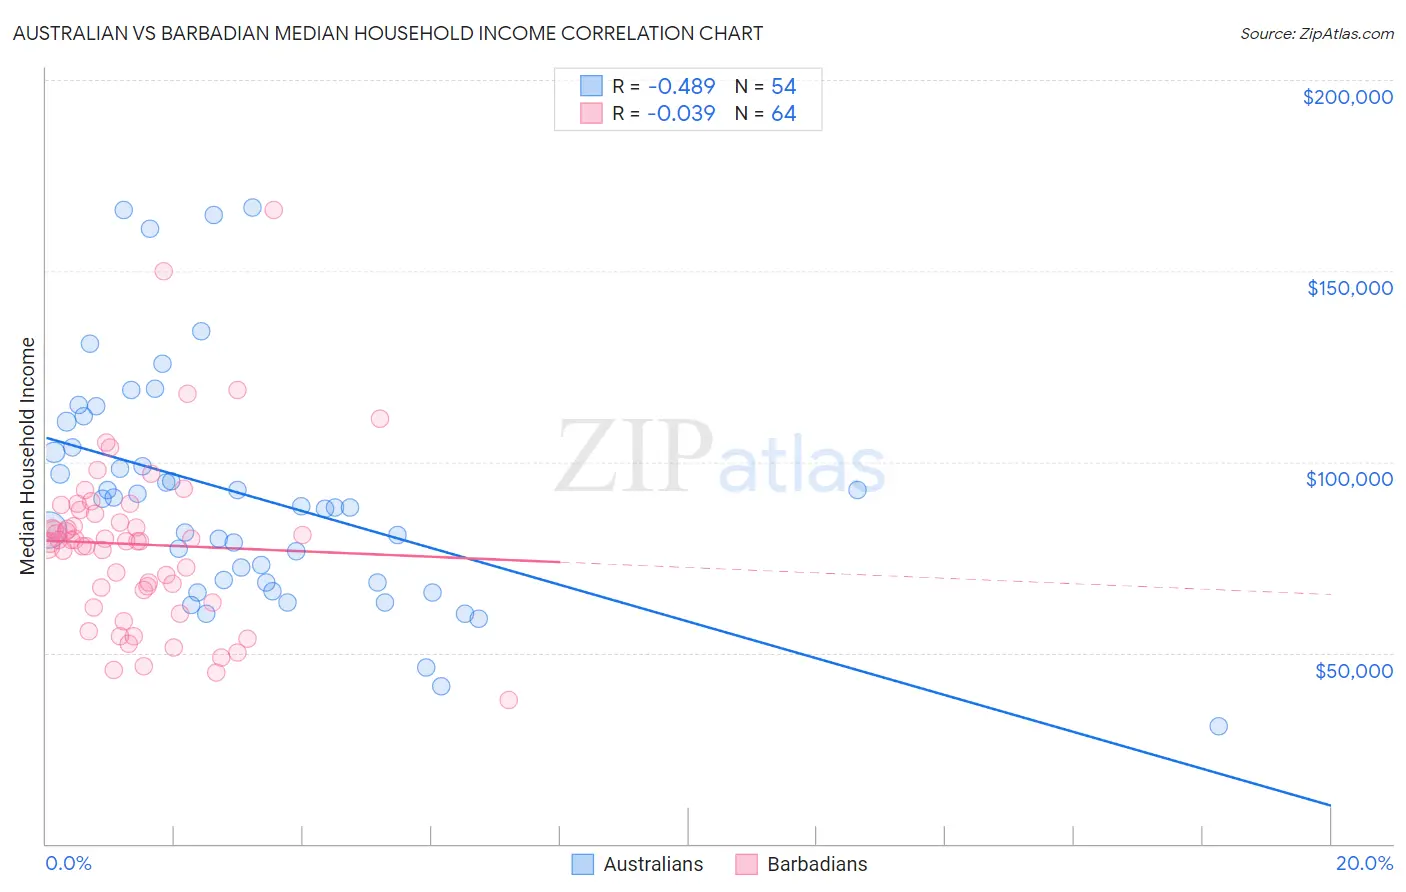
Australian vs Barbadian Median Household Income Correlation Chart
The statistical analysis conducted on geographies consisting of 223,978,576 people shows a moderate negative correlation between the proportion of Australians and median household income in the United States with a correlation coefficient (R) of -0.489 and weighted average of $96,490. Similarly, the statistical analysis conducted on geographies consisting of 141,253,267 people shows no correlation between the proportion of Barbadians and median household income in the United States with a correlation coefficient (R) of -0.039 and weighted average of $79,664, a difference of 21.1%.
Median Household Income Correlation Summary
| Measurement | Australian | Barbadian |
| Minimum | $30,714 | $37,500 |
| Maximum | $166,528 | $166,111 |
| Range | $135,814 | $128,611 |
| Mean | $91,180 | $78,382 |
| Median | $88,142 | $79,225 |
| Interquartile 25% (IQ1) | $68,506 | $64,694 |
| Interquartile 75% (IQ3) | $103,837 | $86,916 |
| Interquartile Range (IQR) | $35,331 | $22,222 |
| Standard Deviation (Sample) | $30,330 | $22,744 |
| Standard Deviation (Population) | $30,047 | $22,565 |
Similar Demographics by Median Household Income
Demographics Similar to Australians by Median Household Income
In terms of median household income, the demographic groups most similar to Australians are Israeli ($96,552, a difference of 0.060%), Immigrants from Russia ($96,378, a difference of 0.12%), Cambodian ($96,324, a difference of 0.17%), Immigrants from Greece ($96,675, a difference of 0.19%), and Immigrants from Malaysia ($96,292, a difference of 0.21%).
| Demographics | Rating | Rank | Median Household Income |
| Afghans | 100.0 /100 | #39 | Exceptional $97,026 |
| Maltese | 100.0 /100 | #40 | Exceptional $97,015 |
| Immigrants | Turkey | 100.0 /100 | #41 | Exceptional $96,964 |
| Immigrants | Lithuania | 99.9 /100 | #42 | Exceptional $96,836 |
| Immigrants | France | 99.9 /100 | #43 | Exceptional $96,743 |
| Immigrants | Greece | 99.9 /100 | #44 | Exceptional $96,675 |
| Israelis | 99.9 /100 | #45 | Exceptional $96,552 |
| Australians | 99.9 /100 | #46 | Exceptional $96,490 |
| Immigrants | Russia | 99.9 /100 | #47 | Exceptional $96,378 |
| Cambodians | 99.9 /100 | #48 | Exceptional $96,324 |
| Immigrants | Malaysia | 99.9 /100 | #49 | Exceptional $96,292 |
| Bulgarians | 99.9 /100 | #50 | Exceptional $96,290 |
| Estonians | 99.9 /100 | #51 | Exceptional $95,930 |
| Immigrants | South Africa | 99.9 /100 | #52 | Exceptional $95,800 |
| Paraguayans | 99.9 /100 | #53 | Exceptional $95,737 |
Demographics Similar to Barbadians by Median Household Income
In terms of median household income, the demographic groups most similar to Barbadians are Nicaraguan ($79,737, a difference of 0.090%), Alaska Native ($79,509, a difference of 0.20%), Immigrants from Western Africa ($79,490, a difference of 0.22%), Immigrants from Bosnia and Herzegovina ($79,888, a difference of 0.28%), and Nonimmigrants ($79,429, a difference of 0.30%).
| Demographics | Rating | Rank | Median Household Income |
| Trinidadians and Tobagonians | 4.7 /100 | #231 | Tragic $80,402 |
| Immigrants | Trinidad and Tobago | 4.6 /100 | #232 | Tragic $80,373 |
| Immigrants | Azores | 4.5 /100 | #233 | Tragic $80,357 |
| Immigrants | Ecuador | 4.5 /100 | #234 | Tragic $80,341 |
| Immigrants | Guyana | 4.5 /100 | #235 | Tragic $80,324 |
| Immigrants | Bosnia and Herzegovina | 3.4 /100 | #236 | Tragic $79,888 |
| Nicaraguans | 3.1 /100 | #237 | Tragic $79,737 |
| Barbadians | 3.0 /100 | #238 | Tragic $79,664 |
| Alaska Natives | 2.7 /100 | #239 | Tragic $79,509 |
| Immigrants | Western Africa | 2.7 /100 | #240 | Tragic $79,490 |
| Immigrants | Nonimmigrants | 2.6 /100 | #241 | Tragic $79,429 |
| Immigrants | Sudan | 2.1 /100 | #242 | Tragic $79,103 |
| Immigrants | Barbados | 1.9 /100 | #243 | Tragic $78,989 |
| Marshallese | 1.9 /100 | #244 | Tragic $78,930 |
| Inupiat | 1.8 /100 | #245 | Tragic $78,841 |