Australian vs Belizean Median Household Income
COMPARE
Australian
Belizean
Median Household Income
Median Household Income Comparison
Australians
Belizeans
$96,490
MEDIAN HOUSEHOLD INCOME
99.9/ 100
METRIC RATING
46th/ 347
METRIC RANK
$77,028
MEDIAN HOUSEHOLD INCOME
0.6/ 100
METRIC RATING
256th/ 347
METRIC RANK
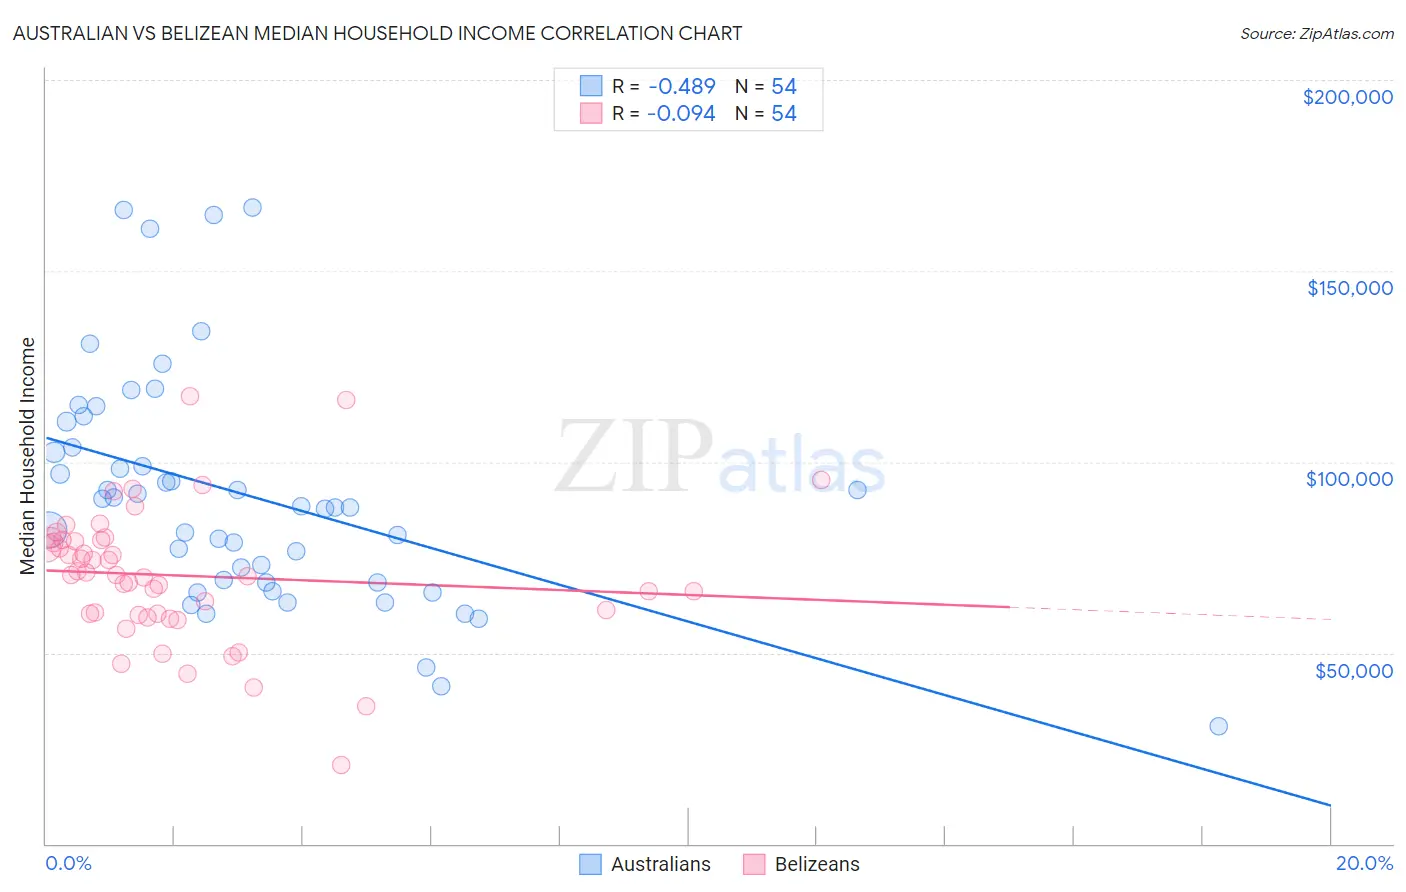
Australian vs Belizean Median Household Income Correlation Chart
The statistical analysis conducted on geographies consisting of 223,978,576 people shows a moderate negative correlation between the proportion of Australians and median household income in the United States with a correlation coefficient (R) of -0.489 and weighted average of $96,490. Similarly, the statistical analysis conducted on geographies consisting of 144,146,880 people shows a slight negative correlation between the proportion of Belizeans and median household income in the United States with a correlation coefficient (R) of -0.094 and weighted average of $77,028, a difference of 25.3%.
Median Household Income Correlation Summary
| Measurement | Australian | Belizean |
| Minimum | $30,714 | $20,723 |
| Maximum | $166,528 | $117,113 |
| Range | $135,814 | $96,390 |
| Mean | $91,180 | $70,224 |
| Median | $88,142 | $70,434 |
| Interquartile 25% (IQ1) | $68,506 | $60,138 |
| Interquartile 75% (IQ3) | $103,837 | $79,527 |
| Interquartile Range (IQR) | $35,331 | $19,389 |
| Standard Deviation (Sample) | $30,330 | $17,495 |
| Standard Deviation (Population) | $30,047 | $17,332 |
Similar Demographics by Median Household Income
Demographics Similar to Australians by Median Household Income
In terms of median household income, the demographic groups most similar to Australians are Israeli ($96,552, a difference of 0.060%), Immigrants from Russia ($96,378, a difference of 0.12%), Cambodian ($96,324, a difference of 0.17%), Immigrants from Greece ($96,675, a difference of 0.19%), and Immigrants from Malaysia ($96,292, a difference of 0.21%).
| Demographics | Rating | Rank | Median Household Income |
| Afghans | 100.0 /100 | #39 | Exceptional $97,026 |
| Maltese | 100.0 /100 | #40 | Exceptional $97,015 |
| Immigrants | Turkey | 100.0 /100 | #41 | Exceptional $96,964 |
| Immigrants | Lithuania | 99.9 /100 | #42 | Exceptional $96,836 |
| Immigrants | France | 99.9 /100 | #43 | Exceptional $96,743 |
| Immigrants | Greece | 99.9 /100 | #44 | Exceptional $96,675 |
| Israelis | 99.9 /100 | #45 | Exceptional $96,552 |
| Australians | 99.9 /100 | #46 | Exceptional $96,490 |
| Immigrants | Russia | 99.9 /100 | #47 | Exceptional $96,378 |
| Cambodians | 99.9 /100 | #48 | Exceptional $96,324 |
| Immigrants | Malaysia | 99.9 /100 | #49 | Exceptional $96,292 |
| Bulgarians | 99.9 /100 | #50 | Exceptional $96,290 |
| Estonians | 99.9 /100 | #51 | Exceptional $95,930 |
| Immigrants | South Africa | 99.9 /100 | #52 | Exceptional $95,800 |
| Paraguayans | 99.9 /100 | #53 | Exceptional $95,737 |
Demographics Similar to Belizeans by Median Household Income
In terms of median household income, the demographic groups most similar to Belizeans are Immigrants from Senegal ($76,915, a difference of 0.15%), Immigrants from Nicaragua ($76,784, a difference of 0.32%), Spanish American Indian ($76,670, a difference of 0.47%), Jamaican ($76,583, a difference of 0.58%), and Immigrants from Grenada ($76,517, a difference of 0.67%).
| Demographics | Rating | Rank | Median Household Income |
| West Indians | 1.4 /100 | #249 | Tragic $78,455 |
| Immigrants | Laos | 1.3 /100 | #250 | Tragic $78,327 |
| Mexican American Indians | 1.2 /100 | #251 | Tragic $78,166 |
| Immigrants | West Indies | 1.0 /100 | #252 | Tragic $77,956 |
| Immigrants | St. Vincent and the Grenadines | 0.9 /100 | #253 | Tragic $77,690 |
| Sub-Saharan Africans | 0.8 /100 | #254 | Tragic $77,631 |
| Immigrants | Middle Africa | 0.8 /100 | #255 | Tragic $77,559 |
| Belizeans | 0.6 /100 | #256 | Tragic $77,028 |
| Immigrants | Senegal | 0.5 /100 | #257 | Tragic $76,915 |
| Immigrants | Nicaragua | 0.5 /100 | #258 | Tragic $76,784 |
| Spanish American Indians | 0.4 /100 | #259 | Tragic $76,670 |
| Jamaicans | 0.4 /100 | #260 | Tragic $76,583 |
| Immigrants | Grenada | 0.4 /100 | #261 | Tragic $76,517 |
| French American Indians | 0.4 /100 | #262 | Tragic $76,387 |
| Alaskan Athabascans | 0.4 /100 | #263 | Tragic $76,383 |