Australian vs Sri Lankan Median Household Income
COMPARE
Australian
Sri Lankan
Median Household Income
Median Household Income Comparison
Australians
Sri Lankans
$96,490
MEDIAN HOUSEHOLD INCOME
99.9/ 100
METRIC RATING
46th/ 347
METRIC RANK
$93,093
MEDIAN HOUSEHOLD INCOME
99.4/ 100
METRIC RATING
79th/ 347
METRIC RANK
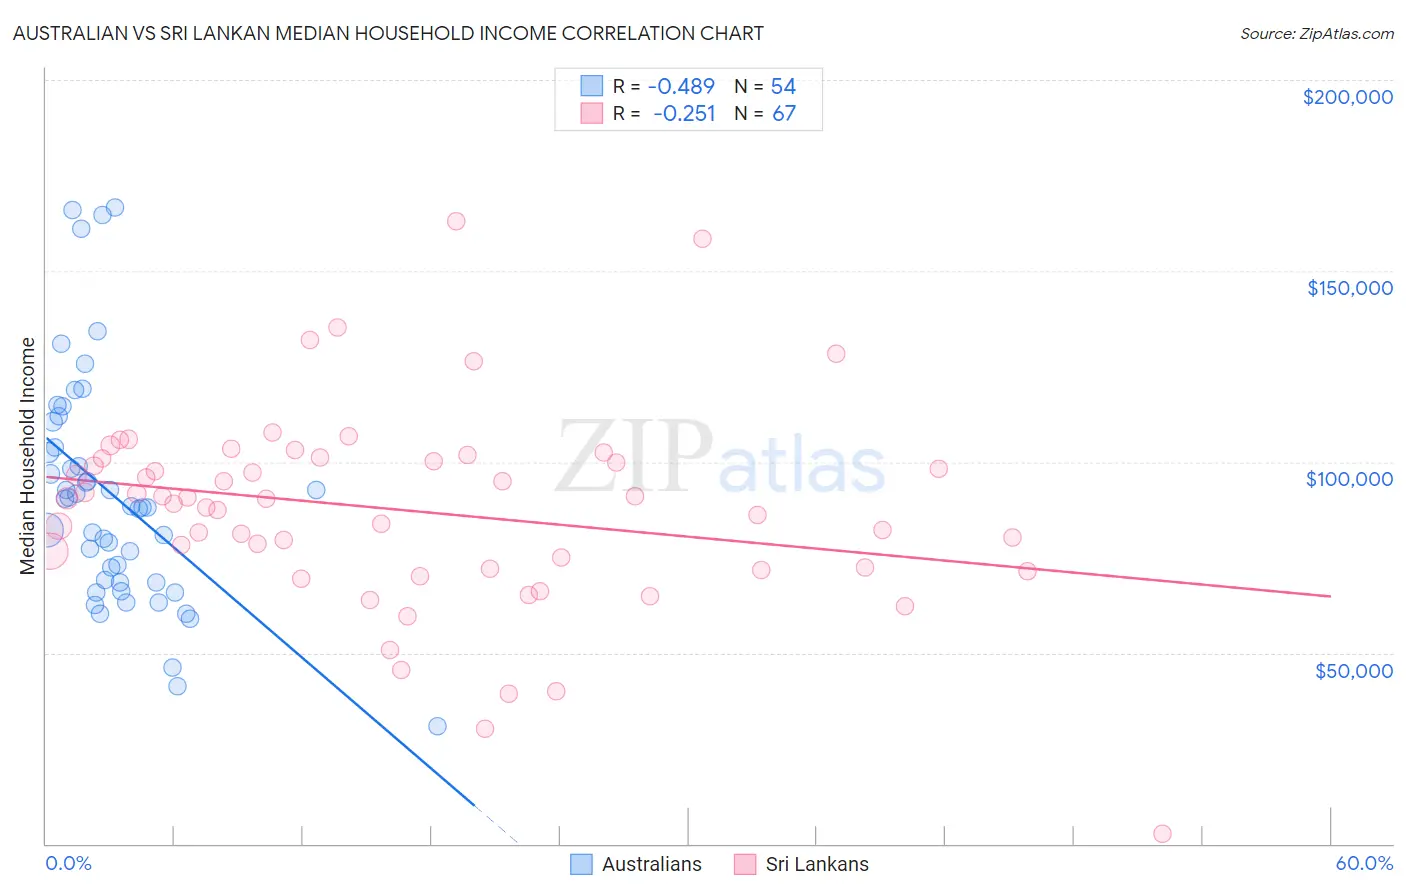
Australian vs Sri Lankan Median Household Income Correlation Chart
The statistical analysis conducted on geographies consisting of 223,978,576 people shows a moderate negative correlation between the proportion of Australians and median household income in the United States with a correlation coefficient (R) of -0.489 and weighted average of $96,490. Similarly, the statistical analysis conducted on geographies consisting of 439,964,424 people shows a weak negative correlation between the proportion of Sri Lankans and median household income in the United States with a correlation coefficient (R) of -0.251 and weighted average of $93,093, a difference of 3.6%.
Median Household Income Correlation Summary
| Measurement | Australian | Sri Lankan |
| Minimum | $30,714 | $2,499 |
| Maximum | $166,528 | $163,019 |
| Range | $135,814 | $160,520 |
| Mean | $91,180 | $87,249 |
| Median | $88,142 | $90,272 |
| Interquartile 25% (IQ1) | $68,506 | $71,944 |
| Interquartile 75% (IQ3) | $103,837 | $100,934 |
| Interquartile Range (IQR) | $35,331 | $28,990 |
| Standard Deviation (Sample) | $30,330 | $26,489 |
| Standard Deviation (Population) | $30,047 | $26,291 |
Similar Demographics by Median Household Income
Demographics Similar to Australians by Median Household Income
In terms of median household income, the demographic groups most similar to Australians are Israeli ($96,552, a difference of 0.060%), Immigrants from Russia ($96,378, a difference of 0.12%), Cambodian ($96,324, a difference of 0.17%), Immigrants from Greece ($96,675, a difference of 0.19%), and Immigrants from Malaysia ($96,292, a difference of 0.21%).
| Demographics | Rating | Rank | Median Household Income |
| Afghans | 100.0 /100 | #39 | Exceptional $97,026 |
| Maltese | 100.0 /100 | #40 | Exceptional $97,015 |
| Immigrants | Turkey | 100.0 /100 | #41 | Exceptional $96,964 |
| Immigrants | Lithuania | 99.9 /100 | #42 | Exceptional $96,836 |
| Immigrants | France | 99.9 /100 | #43 | Exceptional $96,743 |
| Immigrants | Greece | 99.9 /100 | #44 | Exceptional $96,675 |
| Israelis | 99.9 /100 | #45 | Exceptional $96,552 |
| Australians | 99.9 /100 | #46 | Exceptional $96,490 |
| Immigrants | Russia | 99.9 /100 | #47 | Exceptional $96,378 |
| Cambodians | 99.9 /100 | #48 | Exceptional $96,324 |
| Immigrants | Malaysia | 99.9 /100 | #49 | Exceptional $96,292 |
| Bulgarians | 99.9 /100 | #50 | Exceptional $96,290 |
| Estonians | 99.9 /100 | #51 | Exceptional $95,930 |
| Immigrants | South Africa | 99.9 /100 | #52 | Exceptional $95,800 |
| Paraguayans | 99.9 /100 | #53 | Exceptional $95,737 |
Demographics Similar to Sri Lankans by Median Household Income
In terms of median household income, the demographic groups most similar to Sri Lankans are Tongan ($93,076, a difference of 0.020%), Immigrants from Eastern Europe ($93,051, a difference of 0.050%), Immigrants from Bulgaria ($93,148, a difference of 0.060%), Immigrants from Afghanistan ($93,375, a difference of 0.30%), and South African ($93,379, a difference of 0.31%).
| Demographics | Rating | Rank | Median Household Income |
| Lithuanians | 99.6 /100 | #72 | Exceptional $93,852 |
| Immigrants | Egypt | 99.6 /100 | #73 | Exceptional $93,700 |
| Immigrants | Latvia | 99.6 /100 | #74 | Exceptional $93,602 |
| Immigrants | Italy | 99.5 /100 | #75 | Exceptional $93,465 |
| South Africans | 99.5 /100 | #76 | Exceptional $93,379 |
| Immigrants | Afghanistan | 99.5 /100 | #77 | Exceptional $93,375 |
| Immigrants | Bulgaria | 99.4 /100 | #78 | Exceptional $93,148 |
| Sri Lankans | 99.4 /100 | #79 | Exceptional $93,093 |
| Tongans | 99.4 /100 | #80 | Exceptional $93,076 |
| Immigrants | Eastern Europe | 99.4 /100 | #81 | Exceptional $93,051 |
| Immigrants | Spain | 99.3 /100 | #82 | Exceptional $92,732 |
| Italians | 99.1 /100 | #83 | Exceptional $92,475 |
| Immigrants | Argentina | 99.1 /100 | #84 | Exceptional $92,417 |
| Immigrants | Croatia | 99.0 /100 | #85 | Exceptional $92,225 |
| Immigrants | England | 98.9 /100 | #86 | Exceptional $92,098 |