Australian vs Immigrants from Serbia 10th Grade
COMPARE
Australian
Immigrants from Serbia
10th Grade
10th Grade Comparison
Australians
Immigrants from Serbia
95.1%
10TH GRADE
99.9/ 100
METRIC RATING
48th/ 347
METRIC RANK
94.5%
10TH GRADE
97.4/ 100
METRIC RATING
106th/ 347
METRIC RANK
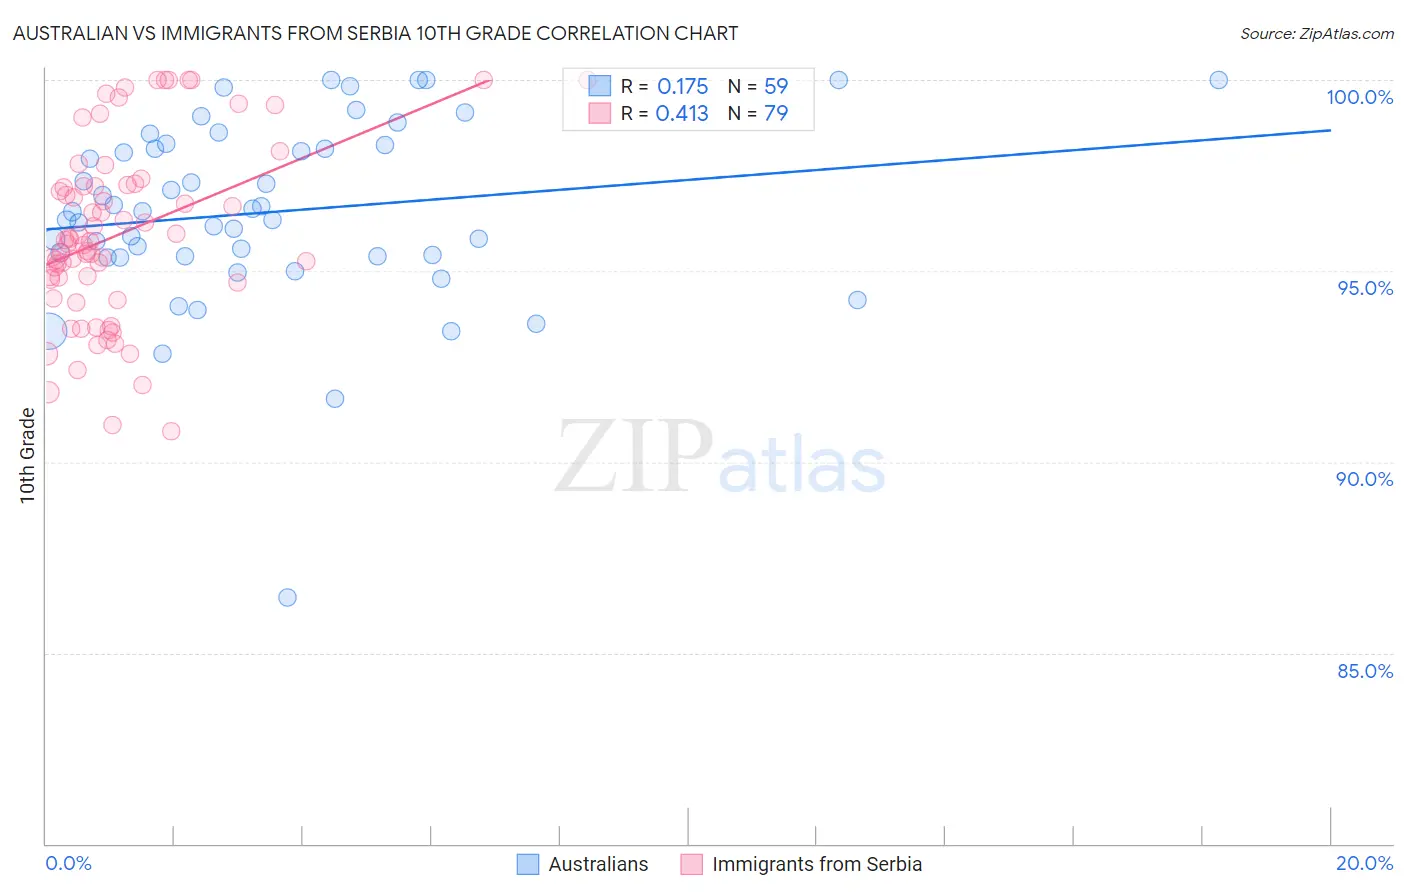
Australian vs Immigrants from Serbia 10th Grade Correlation Chart
The statistical analysis conducted on geographies consisting of 224,153,693 people shows a poor positive correlation between the proportion of Australians and percentage of population with at least 10th grade education in the United States with a correlation coefficient (R) of 0.175 and weighted average of 95.1%. Similarly, the statistical analysis conducted on geographies consisting of 131,729,423 people shows a moderate positive correlation between the proportion of Immigrants from Serbia and percentage of population with at least 10th grade education in the United States with a correlation coefficient (R) of 0.413 and weighted average of 94.5%, a difference of 0.67%.
10th Grade Correlation Summary
| Measurement | Australian | Immigrants from Serbia |
| Minimum | 86.5% | 90.8% |
| Maximum | 100.0% | 100.0% |
| Range | 13.5% | 9.2% |
| Mean | 96.5% | 96.0% |
| Median | 96.5% | 95.8% |
| Interquartile 25% (IQ1) | 95.4% | 94.7% |
| Interquartile 75% (IQ3) | 98.3% | 97.3% |
| Interquartile Range (IQR) | 2.9% | 2.6% |
| Standard Deviation (Sample) | 2.4% | 2.3% |
| Standard Deviation (Population) | 2.4% | 2.3% |
Similar Demographics by 10th Grade
Demographics Similar to Australians by 10th Grade
In terms of 10th grade, the demographic groups most similar to Australians are Czechoslovakian (95.1%, a difference of 0.020%), Serbian (95.1%, a difference of 0.020%), Immigrants from Northern Europe (95.2%, a difference of 0.030%), Greek (95.2%, a difference of 0.030%), and Immigrants from Austria (95.1%, a difference of 0.030%).
| Demographics | Rating | Rank | 10th Grade |
| Russians | 99.9 /100 | #41 | Exceptional 95.2% |
| Slavs | 99.9 /100 | #42 | Exceptional 95.2% |
| Macedonians | 99.9 /100 | #43 | Exceptional 95.2% |
| Immigrants | Northern Europe | 99.9 /100 | #44 | Exceptional 95.2% |
| Greeks | 99.9 /100 | #45 | Exceptional 95.2% |
| Czechoslovakians | 99.9 /100 | #46 | Exceptional 95.1% |
| Serbians | 99.9 /100 | #47 | Exceptional 95.1% |
| Australians | 99.9 /100 | #48 | Exceptional 95.1% |
| Immigrants | Austria | 99.9 /100 | #49 | Exceptional 95.1% |
| Immigrants | Canada | 99.8 /100 | #50 | Exceptional 95.1% |
| Austrians | 99.8 /100 | #51 | Exceptional 95.1% |
| Ottawa | 99.8 /100 | #52 | Exceptional 95.1% |
| Immigrants | North America | 99.8 /100 | #53 | Exceptional 95.0% |
| Immigrants | Lithuania | 99.8 /100 | #54 | Exceptional 95.0% |
| Immigrants | Ireland | 99.8 /100 | #55 | Exceptional 95.0% |
Demographics Similar to Immigrants from Serbia by 10th Grade
In terms of 10th grade, the demographic groups most similar to Immigrants from Serbia are Immigrants from Turkey (94.5%, a difference of 0.0%), Immigrants from Croatia (94.5%, a difference of 0.0%), Immigrants from Europe (94.5%, a difference of 0.010%), Immigrants from Romania (94.5%, a difference of 0.010%), and Immigrants from North Macedonia (94.5%, a difference of 0.010%).
| Demographics | Rating | Rank | 10th Grade |
| Immigrants | France | 97.9 /100 | #99 | Exceptional 94.5% |
| Immigrants | South Central Asia | 97.8 /100 | #100 | Exceptional 94.5% |
| Syrians | 97.7 /100 | #101 | Exceptional 94.5% |
| Cambodians | 97.6 /100 | #102 | Exceptional 94.5% |
| Immigrants | Europe | 97.5 /100 | #103 | Exceptional 94.5% |
| Immigrants | Romania | 97.5 /100 | #104 | Exceptional 94.5% |
| Immigrants | Turkey | 97.4 /100 | #105 | Exceptional 94.5% |
| Immigrants | Serbia | 97.4 /100 | #106 | Exceptional 94.5% |
| Immigrants | Croatia | 97.4 /100 | #107 | Exceptional 94.5% |
| Immigrants | North Macedonia | 97.2 /100 | #108 | Exceptional 94.5% |
| Immigrants | Norway | 97.2 /100 | #109 | Exceptional 94.5% |
| Burmese | 97.1 /100 | #110 | Exceptional 94.5% |
| Immigrants | Zimbabwe | 96.8 /100 | #111 | Exceptional 94.4% |
| Immigrants | Kuwait | 96.8 /100 | #112 | Exceptional 94.4% |
| Palestinians | 96.5 /100 | #113 | Exceptional 94.4% |