Australian vs Immigrants from Scotland Median Household Income
COMPARE
Australian
Immigrants from Scotland
Median Household Income
Median Household Income Comparison
Australians
Immigrants from Scotland
$96,490
MEDIAN HOUSEHOLD INCOME
99.9/ 100
METRIC RATING
46th/ 347
METRIC RANK
$94,091
MEDIAN HOUSEHOLD INCOME
99.7/ 100
METRIC RATING
67th/ 347
METRIC RANK
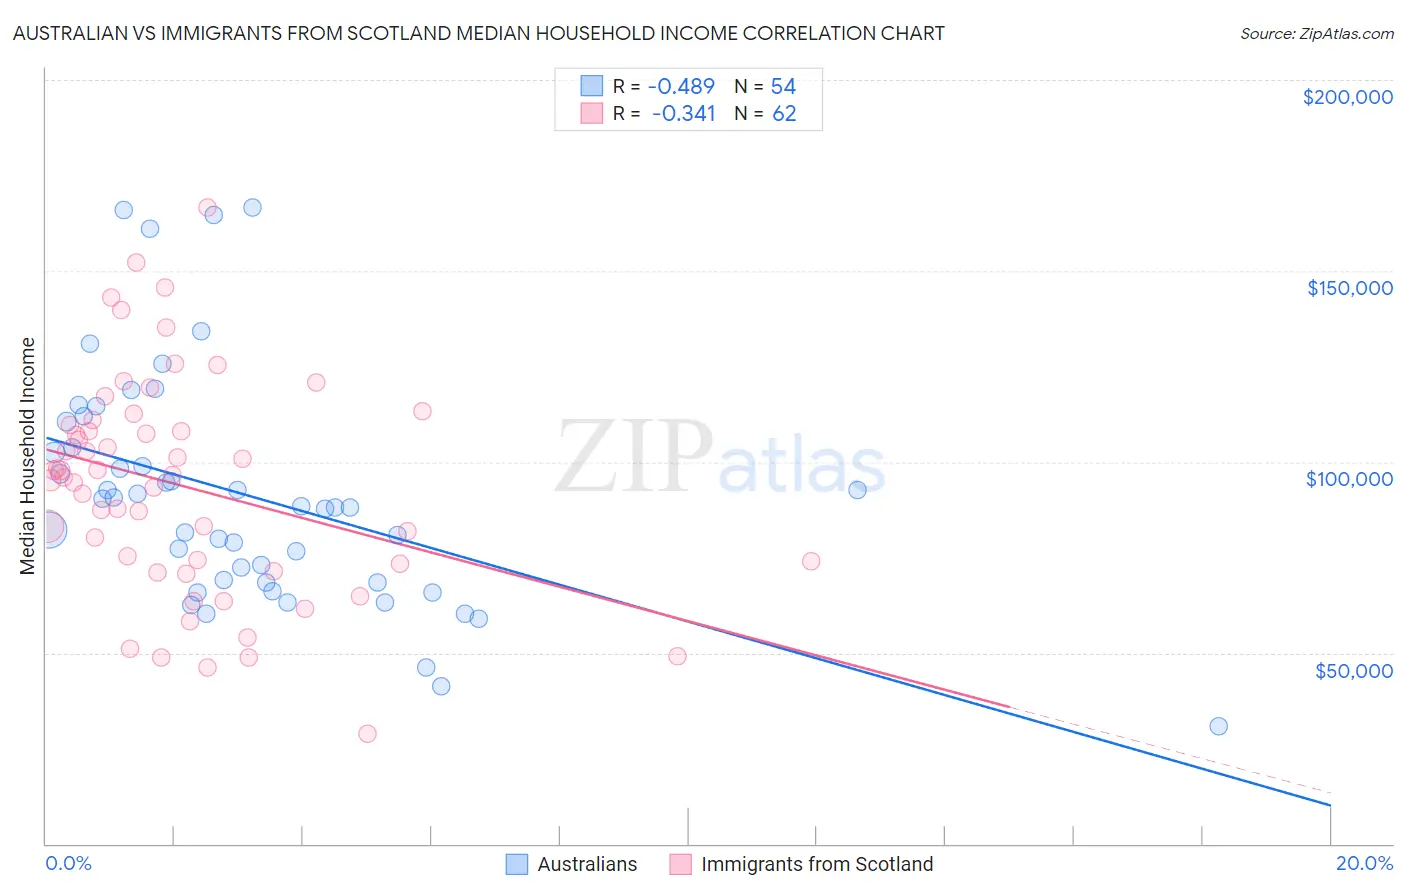
Australian vs Immigrants from Scotland Median Household Income Correlation Chart
The statistical analysis conducted on geographies consisting of 223,978,576 people shows a moderate negative correlation between the proportion of Australians and median household income in the United States with a correlation coefficient (R) of -0.489 and weighted average of $96,490. Similarly, the statistical analysis conducted on geographies consisting of 196,370,497 people shows a mild negative correlation between the proportion of Immigrants from Scotland and median household income in the United States with a correlation coefficient (R) of -0.341 and weighted average of $94,091, a difference of 2.5%.
Median Household Income Correlation Summary
| Measurement | Australian | Immigrants from Scotland |
| Minimum | $30,714 | $28,750 |
| Maximum | $166,528 | $166,597 |
| Range | $135,814 | $137,847 |
| Mean | $91,180 | $93,595 |
| Median | $88,142 | $96,232 |
| Interquartile 25% (IQ1) | $68,506 | $73,269 |
| Interquartile 75% (IQ3) | $103,837 | $109,596 |
| Interquartile Range (IQR) | $35,331 | $36,327 |
| Standard Deviation (Sample) | $30,330 | $28,531 |
| Standard Deviation (Population) | $30,047 | $28,300 |
Similar Demographics by Median Household Income
Demographics Similar to Australians by Median Household Income
In terms of median household income, the demographic groups most similar to Australians are Israeli ($96,552, a difference of 0.060%), Immigrants from Russia ($96,378, a difference of 0.12%), Cambodian ($96,324, a difference of 0.17%), Immigrants from Greece ($96,675, a difference of 0.19%), and Immigrants from Malaysia ($96,292, a difference of 0.21%).
| Demographics | Rating | Rank | Median Household Income |
| Afghans | 100.0 /100 | #39 | Exceptional $97,026 |
| Maltese | 100.0 /100 | #40 | Exceptional $97,015 |
| Immigrants | Turkey | 100.0 /100 | #41 | Exceptional $96,964 |
| Immigrants | Lithuania | 99.9 /100 | #42 | Exceptional $96,836 |
| Immigrants | France | 99.9 /100 | #43 | Exceptional $96,743 |
| Immigrants | Greece | 99.9 /100 | #44 | Exceptional $96,675 |
| Israelis | 99.9 /100 | #45 | Exceptional $96,552 |
| Australians | 99.9 /100 | #46 | Exceptional $96,490 |
| Immigrants | Russia | 99.9 /100 | #47 | Exceptional $96,378 |
| Cambodians | 99.9 /100 | #48 | Exceptional $96,324 |
| Immigrants | Malaysia | 99.9 /100 | #49 | Exceptional $96,292 |
| Bulgarians | 99.9 /100 | #50 | Exceptional $96,290 |
| Estonians | 99.9 /100 | #51 | Exceptional $95,930 |
| Immigrants | South Africa | 99.9 /100 | #52 | Exceptional $95,800 |
| Paraguayans | 99.9 /100 | #53 | Exceptional $95,737 |
Demographics Similar to Immigrants from Scotland by Median Household Income
In terms of median household income, the demographic groups most similar to Immigrants from Scotland are Mongolian ($93,971, a difference of 0.13%), Immigrants from Romania ($94,222, a difference of 0.14%), Argentinean ($93,960, a difference of 0.14%), Immigrants from Fiji ($93,933, a difference of 0.17%), and Immigrants from Philippines ($93,899, a difference of 0.20%).
| Demographics | Rating | Rank | Median Household Income |
| Koreans | 99.8 /100 | #60 | Exceptional $95,018 |
| Laotians | 99.8 /100 | #61 | Exceptional $94,990 |
| Immigrants | Norway | 99.8 /100 | #62 | Exceptional $94,846 |
| Greeks | 99.8 /100 | #63 | Exceptional $94,735 |
| Immigrants | Netherlands | 99.7 /100 | #64 | Exceptional $94,411 |
| Immigrants | Belarus | 99.7 /100 | #65 | Exceptional $94,399 |
| Immigrants | Romania | 99.7 /100 | #66 | Exceptional $94,222 |
| Immigrants | Scotland | 99.7 /100 | #67 | Exceptional $94,091 |
| Mongolians | 99.7 /100 | #68 | Exceptional $93,971 |
| Argentineans | 99.7 /100 | #69 | Exceptional $93,960 |
| Immigrants | Fiji | 99.7 /100 | #70 | Exceptional $93,933 |
| Immigrants | Philippines | 99.6 /100 | #71 | Exceptional $93,899 |
| Lithuanians | 99.6 /100 | #72 | Exceptional $93,852 |
| Immigrants | Egypt | 99.6 /100 | #73 | Exceptional $93,700 |
| Immigrants | Latvia | 99.6 /100 | #74 | Exceptional $93,602 |