Australian vs Bahamian Median Household Income
COMPARE
Australian
Bahamian
Median Household Income
Median Household Income Comparison
Australians
Bahamians
$96,490
MEDIAN HOUSEHOLD INCOME
99.9/ 100
METRIC RATING
46th/ 347
METRIC RANK
$69,726
MEDIAN HOUSEHOLD INCOME
0.0/ 100
METRIC RATING
323rd/ 347
METRIC RANK
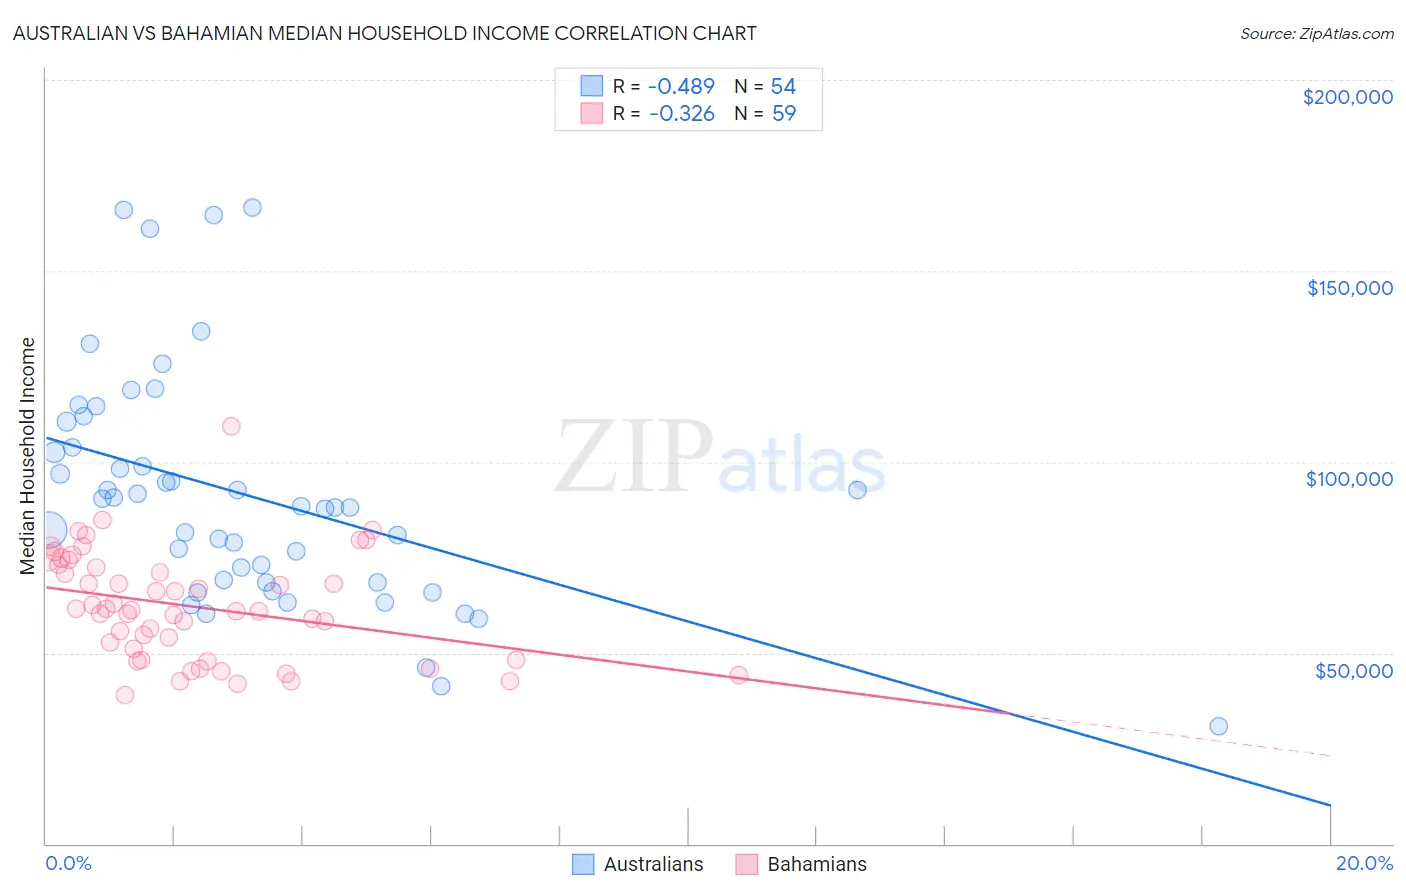
Australian vs Bahamian Median Household Income Correlation Chart
The statistical analysis conducted on geographies consisting of 223,978,576 people shows a moderate negative correlation between the proportion of Australians and median household income in the United States with a correlation coefficient (R) of -0.489 and weighted average of $96,490. Similarly, the statistical analysis conducted on geographies consisting of 112,607,468 people shows a mild negative correlation between the proportion of Bahamians and median household income in the United States with a correlation coefficient (R) of -0.326 and weighted average of $69,726, a difference of 38.4%.
Median Household Income Correlation Summary
| Measurement | Australian | Bahamian |
| Minimum | $30,714 | $38,952 |
| Maximum | $166,528 | $109,393 |
| Range | $135,814 | $70,441 |
| Mean | $91,180 | $62,193 |
| Median | $88,142 | $61,085 |
| Interquartile 25% (IQ1) | $68,506 | $48,214 |
| Interquartile 75% (IQ3) | $103,837 | $73,042 |
| Interquartile Range (IQR) | $35,331 | $24,828 |
| Standard Deviation (Sample) | $30,330 | $14,104 |
| Standard Deviation (Population) | $30,047 | $13,984 |
Similar Demographics by Median Household Income
Demographics Similar to Australians by Median Household Income
In terms of median household income, the demographic groups most similar to Australians are Israeli ($96,552, a difference of 0.060%), Immigrants from Russia ($96,378, a difference of 0.12%), Cambodian ($96,324, a difference of 0.17%), Immigrants from Greece ($96,675, a difference of 0.19%), and Immigrants from Malaysia ($96,292, a difference of 0.21%).
| Demographics | Rating | Rank | Median Household Income |
| Afghans | 100.0 /100 | #39 | Exceptional $97,026 |
| Maltese | 100.0 /100 | #40 | Exceptional $97,015 |
| Immigrants | Turkey | 100.0 /100 | #41 | Exceptional $96,964 |
| Immigrants | Lithuania | 99.9 /100 | #42 | Exceptional $96,836 |
| Immigrants | France | 99.9 /100 | #43 | Exceptional $96,743 |
| Immigrants | Greece | 99.9 /100 | #44 | Exceptional $96,675 |
| Israelis | 99.9 /100 | #45 | Exceptional $96,552 |
| Australians | 99.9 /100 | #46 | Exceptional $96,490 |
| Immigrants | Russia | 99.9 /100 | #47 | Exceptional $96,378 |
| Cambodians | 99.9 /100 | #48 | Exceptional $96,324 |
| Immigrants | Malaysia | 99.9 /100 | #49 | Exceptional $96,292 |
| Bulgarians | 99.9 /100 | #50 | Exceptional $96,290 |
| Estonians | 99.9 /100 | #51 | Exceptional $95,930 |
| Immigrants | South Africa | 99.9 /100 | #52 | Exceptional $95,800 |
| Paraguayans | 99.9 /100 | #53 | Exceptional $95,737 |
Demographics Similar to Bahamians by Median Household Income
In terms of median household income, the demographic groups most similar to Bahamians are Yup'ik ($69,695, a difference of 0.040%), Choctaw ($69,947, a difference of 0.32%), Chickasaw ($70,005, a difference of 0.40%), Seminole ($69,420, a difference of 0.44%), and Colville ($70,094, a difference of 0.53%).
| Demographics | Rating | Rank | Median Household Income |
| Apache | 0.0 /100 | #316 | Tragic $70,927 |
| Cajuns | 0.0 /100 | #317 | Tragic $70,605 |
| Chippewa | 0.0 /100 | #318 | Tragic $70,539 |
| Immigrants | Dominican Republic | 0.0 /100 | #319 | Tragic $70,208 |
| Colville | 0.0 /100 | #320 | Tragic $70,094 |
| Chickasaw | 0.0 /100 | #321 | Tragic $70,005 |
| Choctaw | 0.0 /100 | #322 | Tragic $69,947 |
| Bahamians | 0.0 /100 | #323 | Tragic $69,726 |
| Yup'ik | 0.0 /100 | #324 | Tragic $69,695 |
| Seminole | 0.0 /100 | #325 | Tragic $69,420 |
| Yuman | 0.0 /100 | #326 | Tragic $68,743 |
| Immigrants | Cuba | 0.0 /100 | #327 | Tragic $68,461 |
| Menominee | 0.0 /100 | #328 | Tragic $68,423 |
| Dutch West Indians | 0.0 /100 | #329 | Tragic $68,412 |
| Arapaho | 0.0 /100 | #330 | Tragic $67,965 |