Immigrants from South Central Asia vs Tongan Householder Income Over 65 years
COMPARE
Immigrants from South Central Asia
Tongan
Householder Income Over 65 years
Householder Income Over 65 years Comparison
Immigrants from South Central Asia
Tongans
$70,103
HOUSEHOLDER INCOME OVER 65 YEARS
100.0/ 100
METRIC RATING
20th/ 347
METRIC RANK
$68,235
HOUSEHOLDER INCOME OVER 65 YEARS
100.0/ 100
METRIC RATING
35th/ 347
METRIC RANK
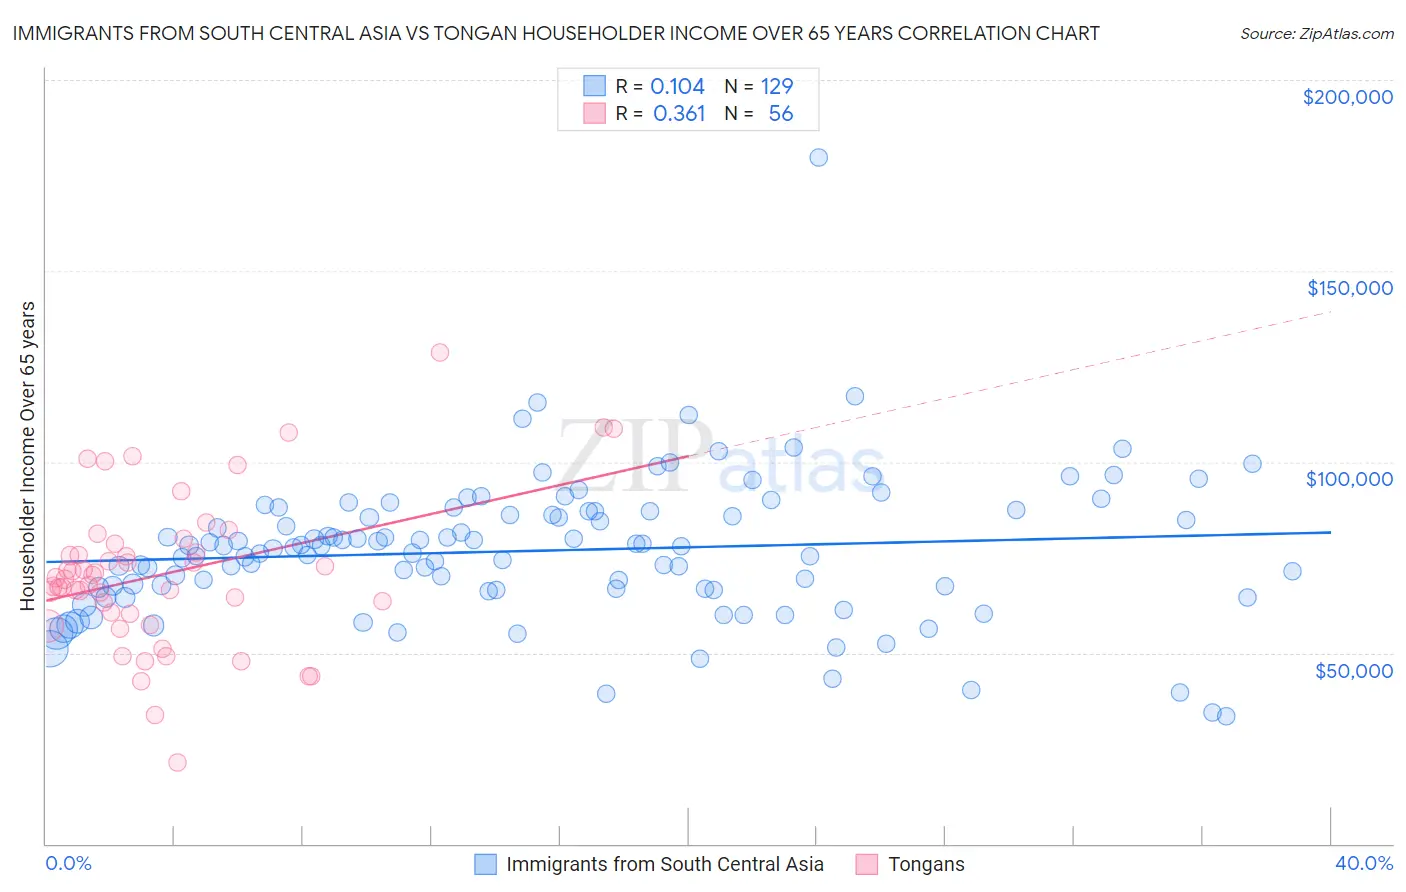
Immigrants from South Central Asia vs Tongan Householder Income Over 65 years Correlation Chart
The statistical analysis conducted on geographies consisting of 470,970,472 people shows a poor positive correlation between the proportion of Immigrants from South Central Asia and household income with householder over the age of 65 in the United States with a correlation coefficient (R) of 0.104 and weighted average of $70,103. Similarly, the statistical analysis conducted on geographies consisting of 102,743,666 people shows a mild positive correlation between the proportion of Tongans and household income with householder over the age of 65 in the United States with a correlation coefficient (R) of 0.361 and weighted average of $68,235, a difference of 2.7%.
Householder Income Over 65 years Correlation Summary
| Measurement | Immigrants from South Central Asia | Tongan |
| Minimum | $33,500 | $21,272 |
| Maximum | $179,808 | $128,750 |
| Range | $146,308 | $107,478 |
| Mean | $76,705 | $70,695 |
| Median | $77,625 | $69,480 |
| Interquartile 25% (IQ1) | $66,593 | $60,415 |
| Interquartile 75% (IQ3) | $87,098 | $77,410 |
| Interquartile Range (IQR) | $20,505 | $16,995 |
| Standard Deviation (Sample) | $18,654 | $19,925 |
| Standard Deviation (Population) | $18,582 | $19,746 |
Demographics Similar to Immigrants from South Central Asia and Tongans by Householder Income Over 65 years
In terms of householder income over 65 years, the demographic groups most similar to Immigrants from South Central Asia are Indian (Asian) ($70,238, a difference of 0.19%), Immigrants from Eastern Asia ($69,872, a difference of 0.33%), Immigrants from Israel ($69,857, a difference of 0.35%), Immigrants from Japan ($69,774, a difference of 0.47%), and Eastern European ($70,470, a difference of 0.52%). Similarly, the demographic groups most similar to Tongans are Immigrants from Austria ($68,208, a difference of 0.040%), Turkish ($68,037, a difference of 0.29%), Immigrants from Ireland ($68,495, a difference of 0.38%), Immigrants from Denmark ($68,801, a difference of 0.83%), and Asian ($68,822, a difference of 0.86%).
| Demographics | Rating | Rank | Householder Income Over 65 years |
| Immigrants | Korea | 100.0 /100 | #17 | Exceptional $70,696 |
| Eastern Europeans | 100.0 /100 | #18 | Exceptional $70,470 |
| Indians (Asian) | 100.0 /100 | #19 | Exceptional $70,238 |
| Immigrants | South Central Asia | 100.0 /100 | #20 | Exceptional $70,103 |
| Immigrants | Eastern Asia | 100.0 /100 | #21 | Exceptional $69,872 |
| Immigrants | Israel | 100.0 /100 | #22 | Exceptional $69,857 |
| Immigrants | Japan | 100.0 /100 | #23 | Exceptional $69,774 |
| Immigrants | Sweden | 100.0 /100 | #24 | Exceptional $69,722 |
| Immigrants | Belgium | 100.0 /100 | #25 | Exceptional $69,703 |
| Immigrants | Sri Lanka | 100.0 /100 | #26 | Exceptional $69,426 |
| Immigrants | Switzerland | 100.0 /100 | #27 | Exceptional $69,343 |
| Immigrants | China | 100.0 /100 | #28 | Exceptional $69,174 |
| Immigrants | Australia | 100.0 /100 | #29 | Exceptional $69,164 |
| Immigrants | Northern Europe | 100.0 /100 | #30 | Exceptional $69,003 |
| Afghans | 100.0 /100 | #31 | Exceptional $68,951 |
| Asians | 100.0 /100 | #32 | Exceptional $68,822 |
| Immigrants | Denmark | 100.0 /100 | #33 | Exceptional $68,801 |
| Immigrants | Ireland | 100.0 /100 | #34 | Exceptional $68,495 |
| Tongans | 100.0 /100 | #35 | Exceptional $68,235 |
| Immigrants | Austria | 99.9 /100 | #36 | Exceptional $68,208 |
| Turks | 99.9 /100 | #37 | Exceptional $68,037 |