Immigrants from North America vs Tongan Householder Income Over 65 years
COMPARE
Immigrants from North America
Tongan
Householder Income Over 65 years
Householder Income Over 65 years Comparison
Immigrants from North America
Tongans
$64,856
HOUSEHOLDER INCOME OVER 65 YEARS
98.3/ 100
METRIC RATING
80th/ 347
METRIC RANK
$68,235
HOUSEHOLDER INCOME OVER 65 YEARS
100.0/ 100
METRIC RATING
35th/ 347
METRIC RANK
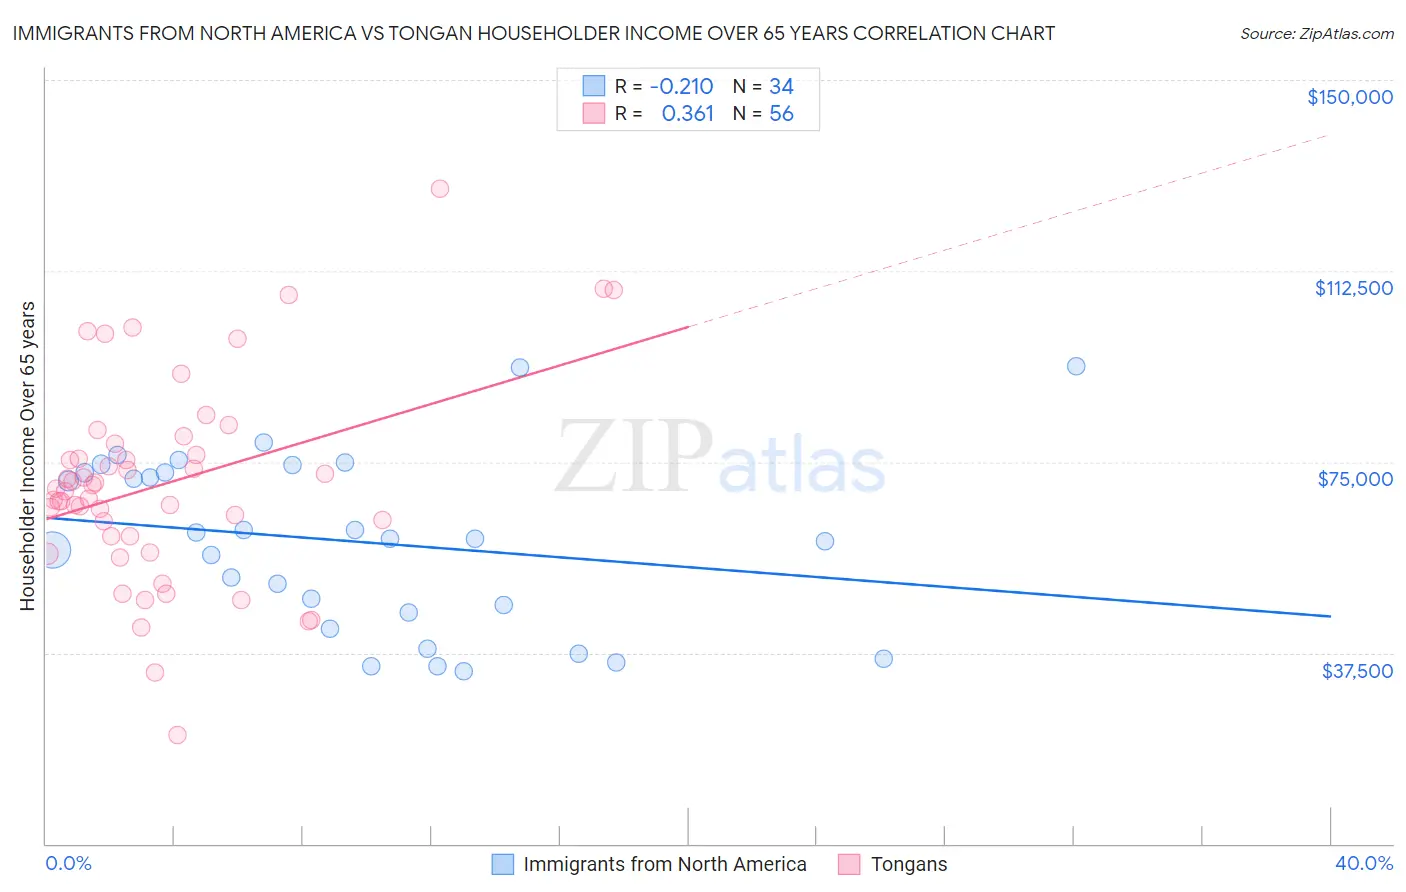
Immigrants from North America vs Tongan Householder Income Over 65 years Correlation Chart
The statistical analysis conducted on geographies consisting of 460,797,771 people shows a weak negative correlation between the proportion of Immigrants from North America and household income with householder over the age of 65 in the United States with a correlation coefficient (R) of -0.210 and weighted average of $64,856. Similarly, the statistical analysis conducted on geographies consisting of 102,743,666 people shows a mild positive correlation between the proportion of Tongans and household income with householder over the age of 65 in the United States with a correlation coefficient (R) of 0.361 and weighted average of $68,235, a difference of 5.2%.
Householder Income Over 65 years Correlation Summary
| Measurement | Immigrants from North America | Tongan |
| Minimum | $33,841 | $21,272 |
| Maximum | $93,750 | $128,750 |
| Range | $59,909 | $107,478 |
| Mean | $59,347 | $70,695 |
| Median | $59,957 | $69,480 |
| Interquartile 25% (IQ1) | $45,537 | $60,415 |
| Interquartile 75% (IQ3) | $72,906 | $77,410 |
| Interquartile Range (IQR) | $27,369 | $16,995 |
| Standard Deviation (Sample) | $17,042 | $19,925 |
| Standard Deviation (Population) | $16,789 | $19,746 |
Similar Demographics by Householder Income Over 65 years
Demographics Similar to Immigrants from North America by Householder Income Over 65 years
In terms of householder income over 65 years, the demographic groups most similar to Immigrants from North America are Immigrants from Europe ($64,828, a difference of 0.040%), Immigrants from Fiji ($64,795, a difference of 0.090%), Hawaiian ($64,920, a difference of 0.10%), Immigrants from Western Europe ($64,933, a difference of 0.12%), and Immigrants from Canada ($64,952, a difference of 0.15%).
| Demographics | Rating | Rank | Householder Income Over 65 years |
| Immigrants | Ethiopia | 98.9 /100 | #73 | Exceptional $65,238 |
| Lithuanians | 98.8 /100 | #74 | Exceptional $65,209 |
| Sierra Leoneans | 98.6 /100 | #75 | Exceptional $65,038 |
| Ethiopians | 98.5 /100 | #76 | Exceptional $64,989 |
| Immigrants | Canada | 98.5 /100 | #77 | Exceptional $64,952 |
| Immigrants | Western Europe | 98.5 /100 | #78 | Exceptional $64,933 |
| Hawaiians | 98.4 /100 | #79 | Exceptional $64,920 |
| Immigrants | North America | 98.3 /100 | #80 | Exceptional $64,856 |
| Immigrants | Europe | 98.3 /100 | #81 | Exceptional $64,828 |
| Immigrants | Fiji | 98.2 /100 | #82 | Exceptional $64,795 |
| Northern Europeans | 97.9 /100 | #83 | Exceptional $64,658 |
| Immigrants | Greece | 97.9 /100 | #84 | Exceptional $64,636 |
| Immigrants | Lebanon | 97.6 /100 | #85 | Exceptional $64,521 |
| Immigrants | Russia | 97.6 /100 | #86 | Exceptional $64,512 |
| Austrians | 97.5 /100 | #87 | Exceptional $64,470 |
Demographics Similar to Tongans by Householder Income Over 65 years
In terms of householder income over 65 years, the demographic groups most similar to Tongans are Immigrants from Austria ($68,208, a difference of 0.040%), Turkish ($68,037, a difference of 0.29%), Immigrants from Ireland ($68,495, a difference of 0.38%), Estonian ($67,926, a difference of 0.46%), and Immigrants from Denmark ($68,801, a difference of 0.83%).
| Demographics | Rating | Rank | Householder Income Over 65 years |
| Immigrants | China | 100.0 /100 | #28 | Exceptional $69,174 |
| Immigrants | Australia | 100.0 /100 | #29 | Exceptional $69,164 |
| Immigrants | Northern Europe | 100.0 /100 | #30 | Exceptional $69,003 |
| Afghans | 100.0 /100 | #31 | Exceptional $68,951 |
| Asians | 100.0 /100 | #32 | Exceptional $68,822 |
| Immigrants | Denmark | 100.0 /100 | #33 | Exceptional $68,801 |
| Immigrants | Ireland | 100.0 /100 | #34 | Exceptional $68,495 |
| Tongans | 100.0 /100 | #35 | Exceptional $68,235 |
| Immigrants | Austria | 99.9 /100 | #36 | Exceptional $68,208 |
| Turks | 99.9 /100 | #37 | Exceptional $68,037 |
| Estonians | 99.9 /100 | #38 | Exceptional $67,926 |
| Russians | 99.9 /100 | #39 | Exceptional $67,626 |
| Immigrants | Asia | 99.9 /100 | #40 | Exceptional $67,594 |
| Koreans | 99.9 /100 | #41 | Exceptional $67,472 |
| New Zealanders | 99.9 /100 | #42 | Exceptional $67,333 |