Chickasaw vs Tongan Householder Income Over 65 years
COMPARE
Chickasaw
Tongan
Householder Income Over 65 years
Householder Income Over 65 years Comparison
Chickasaw
Tongans
$53,732
HOUSEHOLDER INCOME OVER 65 YEARS
0.1/ 100
METRIC RATING
290th/ 347
METRIC RANK
$68,235
HOUSEHOLDER INCOME OVER 65 YEARS
100.0/ 100
METRIC RATING
35th/ 347
METRIC RANK
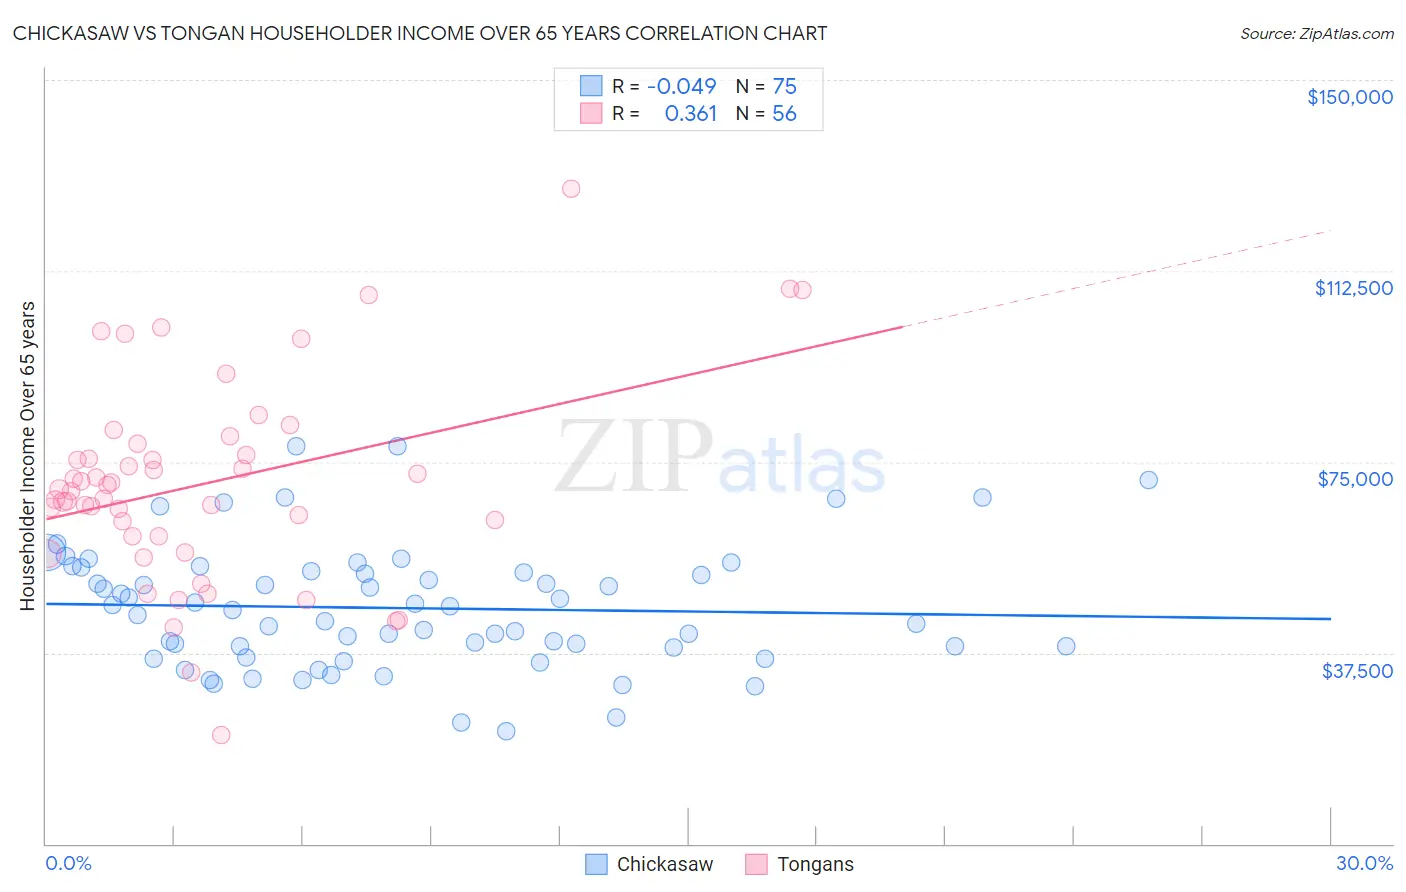
Chickasaw vs Tongan Householder Income Over 65 years Correlation Chart
The statistical analysis conducted on geographies consisting of 147,447,957 people shows no correlation between the proportion of Chickasaw and household income with householder over the age of 65 in the United States with a correlation coefficient (R) of -0.049 and weighted average of $53,732. Similarly, the statistical analysis conducted on geographies consisting of 102,743,666 people shows a mild positive correlation between the proportion of Tongans and household income with householder over the age of 65 in the United States with a correlation coefficient (R) of 0.361 and weighted average of $68,235, a difference of 27.0%.
Householder Income Over 65 years Correlation Summary
| Measurement | Chickasaw | Tongan |
| Minimum | $22,146 | $21,272 |
| Maximum | $78,125 | $128,750 |
| Range | $55,979 | $107,478 |
| Mean | $46,305 | $70,695 |
| Median | $45,875 | $69,480 |
| Interquartile 25% (IQ1) | $38,542 | $60,415 |
| Interquartile 75% (IQ3) | $53,486 | $77,410 |
| Interquartile Range (IQR) | $14,944 | $16,995 |
| Standard Deviation (Sample) | $12,086 | $19,925 |
| Standard Deviation (Population) | $12,005 | $19,746 |
Similar Demographics by Householder Income Over 65 years
Demographics Similar to Chickasaw by Householder Income Over 65 years
In terms of householder income over 65 years, the demographic groups most similar to Chickasaw are Iroquois ($53,737, a difference of 0.010%), African ($53,711, a difference of 0.040%), Immigrants from Barbados ($53,766, a difference of 0.060%), Paiute ($53,762, a difference of 0.060%), and Shoshone ($53,681, a difference of 0.090%).
| Demographics | Rating | Rank | Householder Income Over 65 years |
| Immigrants | Liberia | 0.1 /100 | #283 | Tragic $53,967 |
| Immigrants | Guatemala | 0.1 /100 | #284 | Tragic $53,950 |
| Mexicans | 0.1 /100 | #285 | Tragic $53,897 |
| Chippewa | 0.1 /100 | #286 | Tragic $53,847 |
| Immigrants | Barbados | 0.1 /100 | #287 | Tragic $53,766 |
| Paiute | 0.1 /100 | #288 | Tragic $53,762 |
| Iroquois | 0.1 /100 | #289 | Tragic $53,737 |
| Chickasaw | 0.1 /100 | #290 | Tragic $53,732 |
| Africans | 0.0 /100 | #291 | Tragic $53,711 |
| Shoshone | 0.0 /100 | #292 | Tragic $53,681 |
| Immigrants | Belize | 0.0 /100 | #293 | Tragic $53,665 |
| Senegalese | 0.0 /100 | #294 | Tragic $53,591 |
| Immigrants | Central America | 0.0 /100 | #295 | Tragic $53,420 |
| Immigrants | Somalia | 0.0 /100 | #296 | Tragic $53,333 |
| Immigrants | Latin America | 0.0 /100 | #297 | Tragic $53,265 |
Demographics Similar to Tongans by Householder Income Over 65 years
In terms of householder income over 65 years, the demographic groups most similar to Tongans are Immigrants from Austria ($68,208, a difference of 0.040%), Turkish ($68,037, a difference of 0.29%), Immigrants from Ireland ($68,495, a difference of 0.38%), Estonian ($67,926, a difference of 0.46%), and Immigrants from Denmark ($68,801, a difference of 0.83%).
| Demographics | Rating | Rank | Householder Income Over 65 years |
| Immigrants | China | 100.0 /100 | #28 | Exceptional $69,174 |
| Immigrants | Australia | 100.0 /100 | #29 | Exceptional $69,164 |
| Immigrants | Northern Europe | 100.0 /100 | #30 | Exceptional $69,003 |
| Afghans | 100.0 /100 | #31 | Exceptional $68,951 |
| Asians | 100.0 /100 | #32 | Exceptional $68,822 |
| Immigrants | Denmark | 100.0 /100 | #33 | Exceptional $68,801 |
| Immigrants | Ireland | 100.0 /100 | #34 | Exceptional $68,495 |
| Tongans | 100.0 /100 | #35 | Exceptional $68,235 |
| Immigrants | Austria | 99.9 /100 | #36 | Exceptional $68,208 |
| Turks | 99.9 /100 | #37 | Exceptional $68,037 |
| Estonians | 99.9 /100 | #38 | Exceptional $67,926 |
| Russians | 99.9 /100 | #39 | Exceptional $67,626 |
| Immigrants | Asia | 99.9 /100 | #40 | Exceptional $67,594 |
| Koreans | 99.9 /100 | #41 | Exceptional $67,472 |
| New Zealanders | 99.9 /100 | #42 | Exceptional $67,333 |