Assyrian/Chaldean/Syriac vs Tongan In Labor Force | Age 25-29
COMPARE
Assyrian/Chaldean/Syriac
Tongan
In Labor Force | Age 25-29
In Labor Force | Age 25-29 Comparison
Assyrians/Chaldeans/Syriacs
Tongans
84.7%
IN LABOR FORCE | AGE 25-29
50.2/ 100
METRIC RATING
173rd/ 347
METRIC RANK
84.7%
IN LABOR FORCE | AGE 25-29
52.4/ 100
METRIC RATING
170th/ 347
METRIC RANK
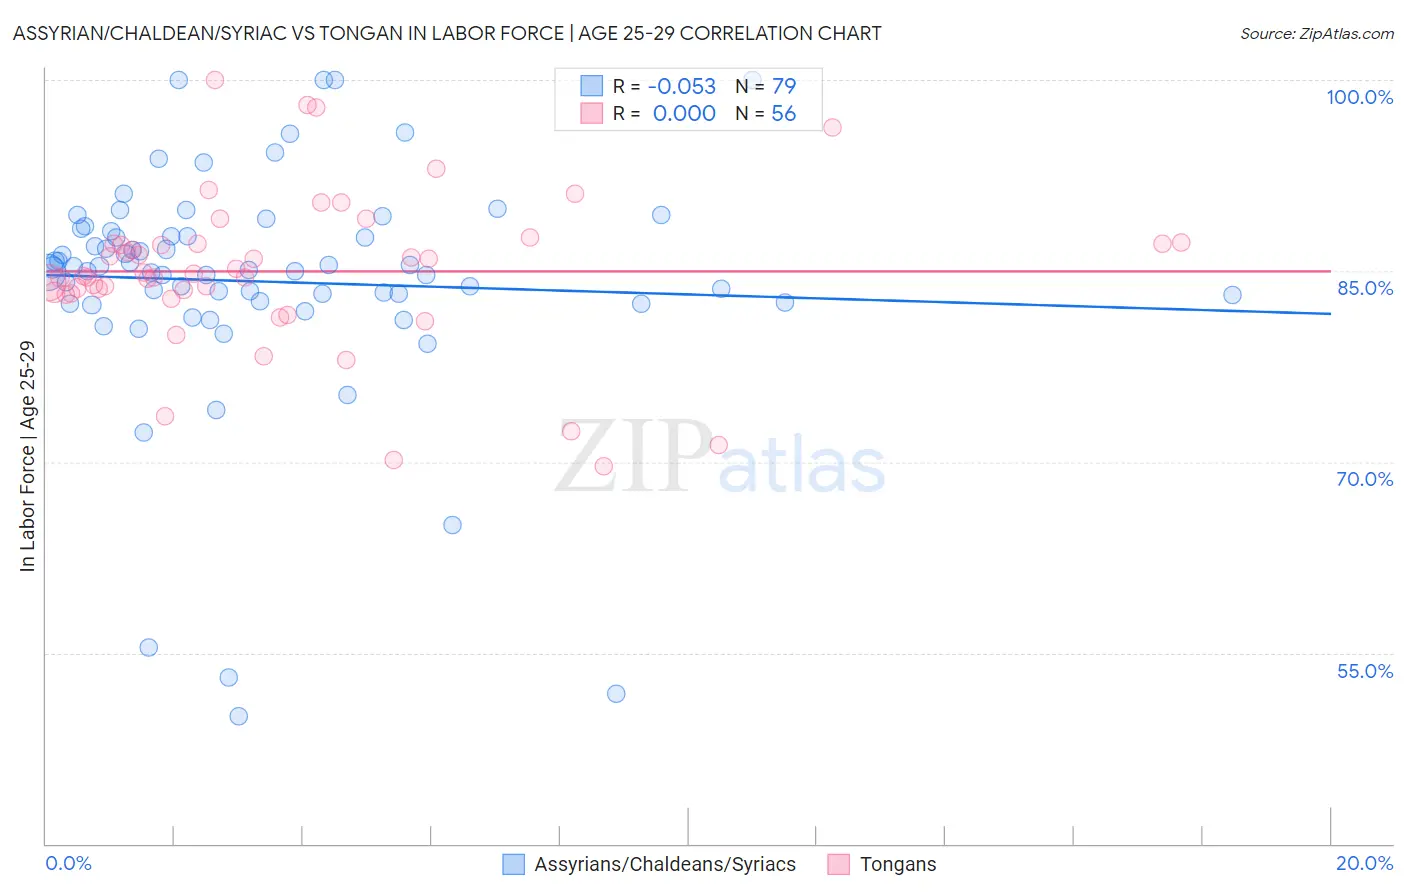
Assyrian/Chaldean/Syriac vs Tongan In Labor Force | Age 25-29 Correlation Chart
The statistical analysis conducted on geographies consisting of 110,302,663 people shows a slight negative correlation between the proportion of Assyrians/Chaldeans/Syriacs and labor force participation rate among population between the ages 25 and 29 in the United States with a correlation coefficient (R) of -0.053 and weighted average of 84.7%. Similarly, the statistical analysis conducted on geographies consisting of 102,903,865 people shows no correlation between the proportion of Tongans and labor force participation rate among population between the ages 25 and 29 in the United States with a correlation coefficient (R) of 0.000 and weighted average of 84.7%, a difference of 0.020%.
In Labor Force | Age 25-29 Correlation Summary
| Measurement | Assyrian/Chaldean/Syriac | Tongan |
| Minimum | 50.0% | 69.7% |
| Maximum | 100.0% | 100.0% |
| Range | 50.0% | 30.3% |
| Mean | 84.2% | 85.0% |
| Median | 85.1% | 84.7% |
| Interquartile 25% (IQ1) | 82.5% | 83.3% |
| Interquartile 75% (IQ3) | 88.1% | 87.1% |
| Interquartile Range (IQR) | 5.6% | 3.8% |
| Standard Deviation (Sample) | 9.3% | 6.2% |
| Standard Deviation (Population) | 9.3% | 6.1% |
Demographics Similar to Assyrians/Chaldeans/Syriacs and Tongans by In Labor Force | Age 25-29
In terms of in labor force | age 25-29, the demographic groups most similar to Assyrians/Chaldeans/Syriacs are Immigrants from Vietnam (84.7%, a difference of 0.0%), Immigrants from Western Europe (84.7%, a difference of 0.0%), Palestinian (84.7%, a difference of 0.0%), Celtic (84.7%, a difference of 0.020%), and Hungarian (84.6%, a difference of 0.020%). Similarly, the demographic groups most similar to Tongans are Celtic (84.7%, a difference of 0.0%), Immigrants from Vietnam (84.7%, a difference of 0.010%), Immigrants from Western Europe (84.7%, a difference of 0.010%), South American (84.7%, a difference of 0.020%), and Palestinian (84.7%, a difference of 0.020%).
| Demographics | Rating | Rank | In Labor Force | Age 25-29 |
| Canadians | 58.5 /100 | #161 | Average 84.7% |
| Immigrants | Colombia | 58.3 /100 | #162 | Average 84.7% |
| Argentineans | 57.9 /100 | #163 | Average 84.7% |
| Ghanaians | 57.6 /100 | #164 | Average 84.7% |
| Immigrants | Burma/Myanmar | 57.4 /100 | #165 | Average 84.7% |
| Immigrants | Spain | 56.9 /100 | #166 | Average 84.7% |
| Indonesians | 56.5 /100 | #167 | Average 84.7% |
| South Americans | 54.9 /100 | #168 | Average 84.7% |
| Celtics | 52.5 /100 | #169 | Average 84.7% |
| Tongans | 52.4 /100 | #170 | Average 84.7% |
| Immigrants | Vietnam | 50.5 /100 | #171 | Average 84.7% |
| Immigrants | Western Europe | 50.4 /100 | #172 | Average 84.7% |
| Assyrians/Chaldeans/Syriacs | 50.2 /100 | #173 | Average 84.7% |
| Palestinians | 50.0 /100 | #174 | Average 84.7% |
| Hungarians | 47.8 /100 | #175 | Average 84.6% |
| Malaysians | 46.8 /100 | #176 | Average 84.6% |
| Immigrants | China | 45.7 /100 | #177 | Average 84.6% |
| Immigrants | Thailand | 45.2 /100 | #178 | Average 84.6% |
| Immigrants | Argentina | 44.0 /100 | #179 | Average 84.6% |
| Immigrants | South America | 42.9 /100 | #180 | Average 84.6% |
| Immigrants | Norway | 41.9 /100 | #181 | Average 84.6% |