Assyrian/Chaldean/Syriac vs Immigrants from Netherlands Median Earnings
COMPARE
Assyrian/Chaldean/Syriac
Immigrants from Netherlands
Median Earnings
Median Earnings Comparison
Assyrians/Chaldeans/Syriacs
Immigrants from Netherlands
$48,304
MEDIAN EARNINGS
93.3/ 100
METRIC RATING
126th/ 347
METRIC RANK
$50,818
MEDIAN EARNINGS
99.8/ 100
METRIC RATING
73rd/ 347
METRIC RANK
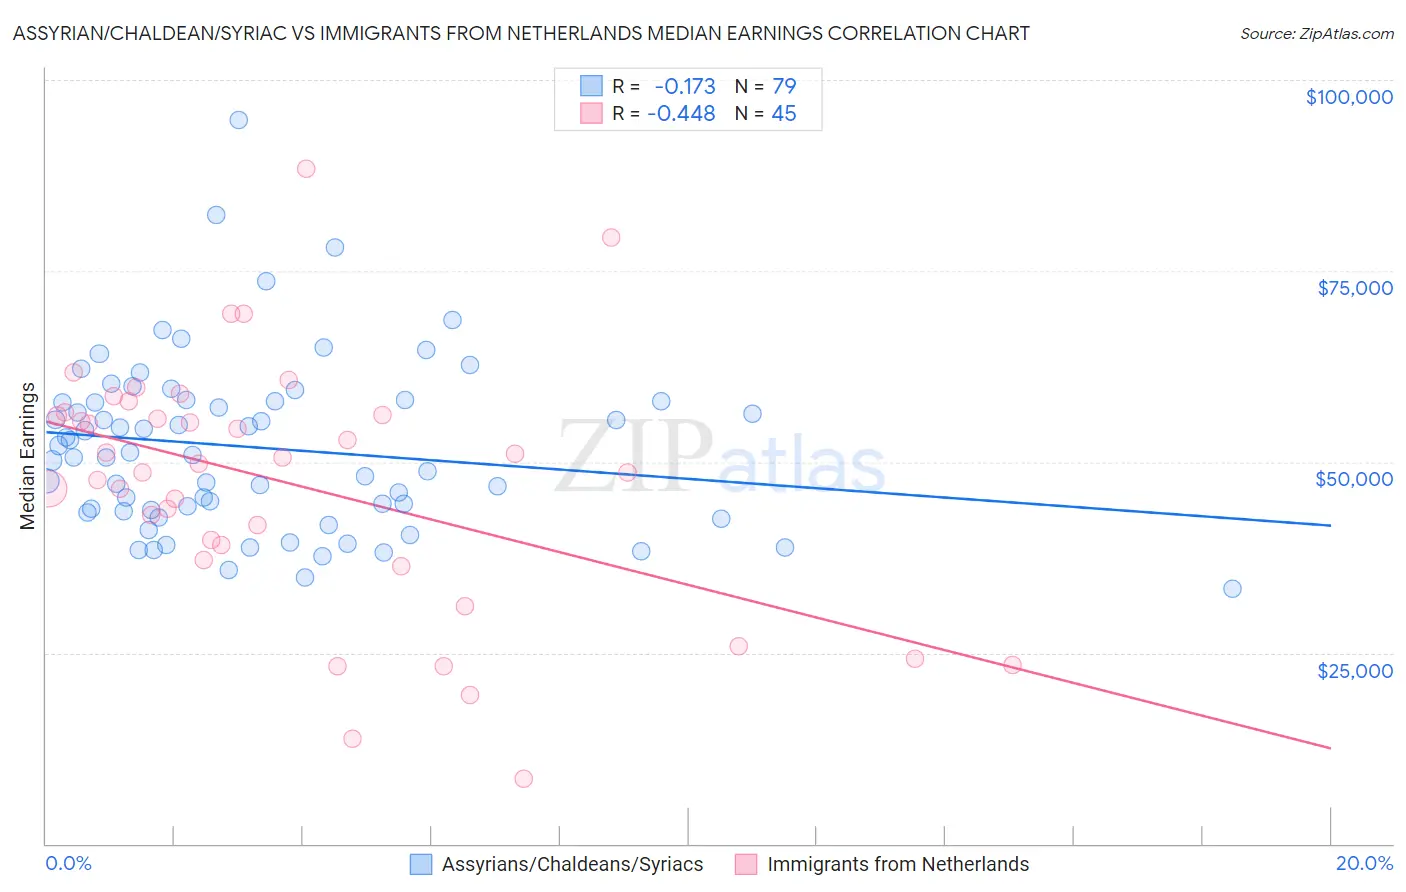
Assyrian/Chaldean/Syriac vs Immigrants from Netherlands Median Earnings Correlation Chart
The statistical analysis conducted on geographies consisting of 110,275,669 people shows a poor negative correlation between the proportion of Assyrians/Chaldeans/Syriacs and median earnings in the United States with a correlation coefficient (R) of -0.173 and weighted average of $48,304. Similarly, the statistical analysis conducted on geographies consisting of 237,873,103 people shows a moderate negative correlation between the proportion of Immigrants from Netherlands and median earnings in the United States with a correlation coefficient (R) of -0.448 and weighted average of $50,818, a difference of 5.2%.
Median Earnings Correlation Summary
| Measurement | Assyrian/Chaldean/Syriac | Immigrants from Netherlands |
| Minimum | $33,351 | $8,447 |
| Maximum | $94,792 | $88,336 |
| Range | $61,441 | $79,889 |
| Mean | $51,833 | $47,130 |
| Median | $50,898 | $49,796 |
| Interquartile 25% (IQ1) | $43,507 | $38,138 |
| Interquartile 75% (IQ3) | $57,898 | $56,269 |
| Interquartile Range (IQR) | $14,391 | $18,130 |
| Standard Deviation (Sample) | $11,326 | $16,545 |
| Standard Deviation (Population) | $11,254 | $16,360 |
Similar Demographics by Median Earnings
Demographics Similar to Assyrians/Chaldeans/Syriacs by Median Earnings
In terms of median earnings, the demographic groups most similar to Assyrians/Chaldeans/Syriacs are Immigrants from Fiji ($48,305, a difference of 0.0%), Sierra Leonean ($48,286, a difference of 0.040%), Immigrants from Philippines ($48,266, a difference of 0.080%), Pakistani ($48,254, a difference of 0.10%), and Brazilian ($48,356, a difference of 0.11%).
| Demographics | Rating | Rank | Median Earnings |
| Poles | 95.8 /100 | #119 | Exceptional $48,659 |
| Carpatho Rusyns | 95.5 /100 | #120 | Exceptional $48,617 |
| Arabs | 95.4 /100 | #121 | Exceptional $48,599 |
| Chileans | 94.8 /100 | #122 | Exceptional $48,504 |
| Immigrants | Syria | 93.9 /100 | #123 | Exceptional $48,375 |
| Brazilians | 93.7 /100 | #124 | Exceptional $48,356 |
| Immigrants | Fiji | 93.3 /100 | #125 | Exceptional $48,305 |
| Assyrians/Chaldeans/Syriacs | 93.3 /100 | #126 | Exceptional $48,304 |
| Sierra Leoneans | 93.1 /100 | #127 | Exceptional $48,286 |
| Immigrants | Philippines | 92.9 /100 | #128 | Exceptional $48,266 |
| Pakistanis | 92.8 /100 | #129 | Exceptional $48,254 |
| Zimbabweans | 92.6 /100 | #130 | Exceptional $48,229 |
| Lebanese | 92.5 /100 | #131 | Exceptional $48,226 |
| British | 92.2 /100 | #132 | Exceptional $48,189 |
| Immigrants | Uganda | 90.5 /100 | #133 | Exceptional $48,041 |
Demographics Similar to Immigrants from Netherlands by Median Earnings
In terms of median earnings, the demographic groups most similar to Immigrants from Netherlands are South African ($50,752, a difference of 0.13%), Immigrants from Scotland ($50,741, a difference of 0.15%), Immigrants from Egypt ($50,901, a difference of 0.16%), Immigrants from Ukraine ($50,984, a difference of 0.33%), and Lithuanian ($50,991, a difference of 0.34%).
| Demographics | Rating | Rank | Median Earnings |
| Afghans | 99.9 /100 | #66 | Exceptional $51,112 |
| Immigrants | Spain | 99.9 /100 | #67 | Exceptional $51,092 |
| Paraguayans | 99.9 /100 | #68 | Exceptional $51,068 |
| Mongolians | 99.8 /100 | #69 | Exceptional $51,038 |
| Lithuanians | 99.8 /100 | #70 | Exceptional $50,991 |
| Immigrants | Ukraine | 99.8 /100 | #71 | Exceptional $50,984 |
| Immigrants | Egypt | 99.8 /100 | #72 | Exceptional $50,901 |
| Immigrants | Netherlands | 99.8 /100 | #73 | Exceptional $50,818 |
| South Africans | 99.8 /100 | #74 | Exceptional $50,752 |
| Immigrants | Scotland | 99.8 /100 | #75 | Exceptional $50,741 |
| Immigrants | Italy | 99.7 /100 | #76 | Exceptional $50,581 |
| Immigrants | Western Europe | 99.7 /100 | #77 | Exceptional $50,549 |
| Argentineans | 99.6 /100 | #78 | Exceptional $50,399 |
| Laotians | 99.6 /100 | #79 | Exceptional $50,343 |
| Ukrainians | 99.6 /100 | #80 | Exceptional $50,320 |