Assyrian/Chaldean/Syriac vs Thai Median Earnings
COMPARE
Assyrian/Chaldean/Syriac
Thai
Median Earnings
Median Earnings Comparison
Assyrians/Chaldeans/Syriacs
Thais
$48,304
MEDIAN EARNINGS
93.3/ 100
METRIC RATING
126th/ 347
METRIC RANK
$59,237
MEDIAN EARNINGS
100.0/ 100
METRIC RATING
5th/ 347
METRIC RANK
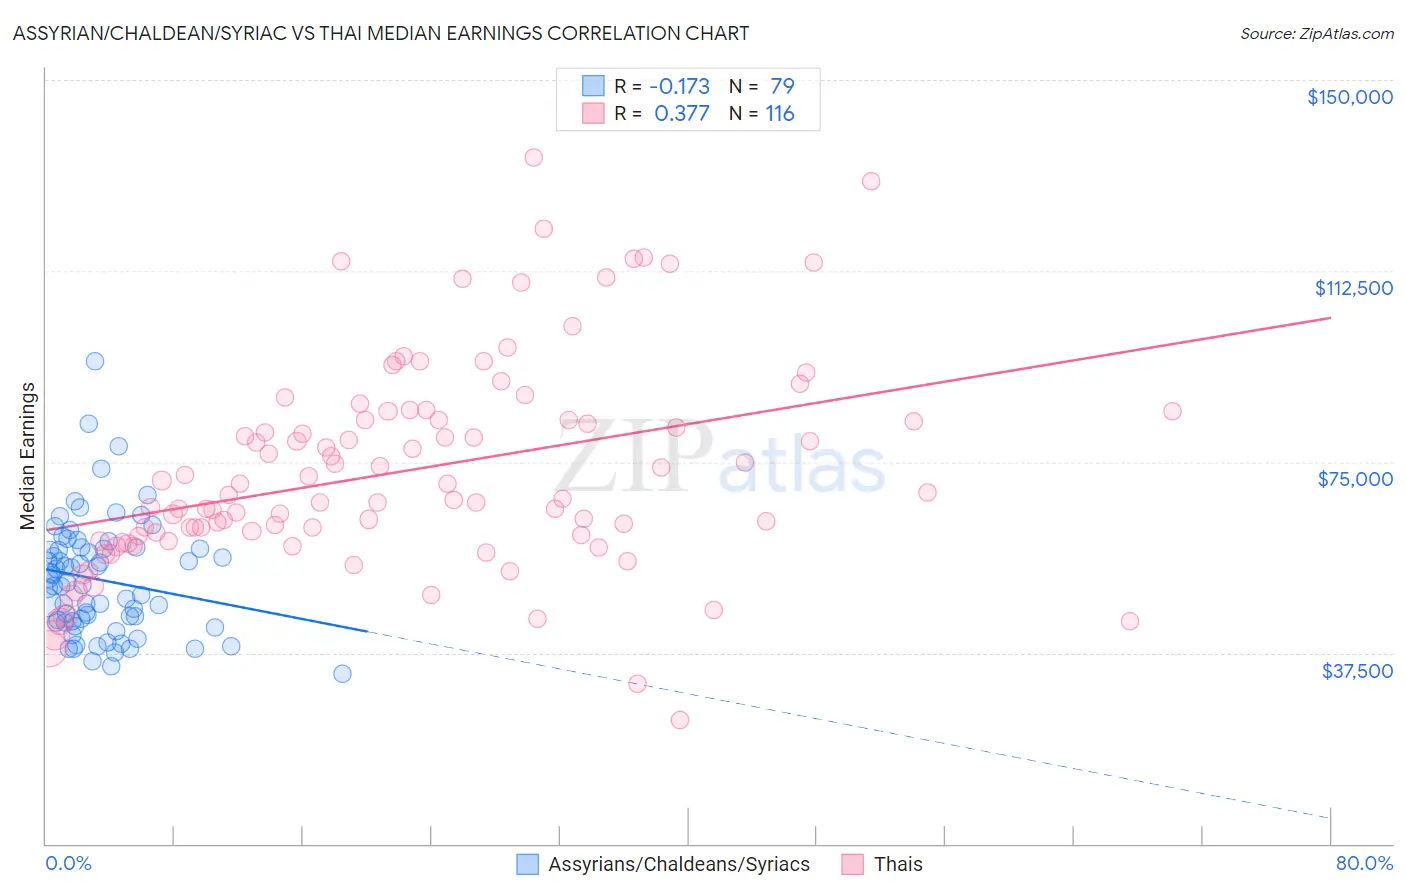
Assyrian/Chaldean/Syriac vs Thai Median Earnings Correlation Chart
The statistical analysis conducted on geographies consisting of 110,275,669 people shows a poor negative correlation between the proportion of Assyrians/Chaldeans/Syriacs and median earnings in the United States with a correlation coefficient (R) of -0.173 and weighted average of $48,304. Similarly, the statistical analysis conducted on geographies consisting of 475,851,474 people shows a mild positive correlation between the proportion of Thais and median earnings in the United States with a correlation coefficient (R) of 0.377 and weighted average of $59,237, a difference of 22.6%.
Median Earnings Correlation Summary
| Measurement | Assyrian/Chaldean/Syriac | Thai |
| Minimum | $33,351 | $24,353 |
| Maximum | $94,792 | $134,793 |
| Range | $61,441 | $110,440 |
| Mean | $51,833 | $73,089 |
| Median | $50,898 | $68,147 |
| Interquartile 25% (IQ1) | $43,507 | $59,963 |
| Interquartile 75% (IQ3) | $57,898 | $83,196 |
| Interquartile Range (IQR) | $14,391 | $23,232 |
| Standard Deviation (Sample) | $11,326 | $20,568 |
| Standard Deviation (Population) | $11,254 | $20,479 |
Similar Demographics by Median Earnings
Demographics Similar to Assyrians/Chaldeans/Syriacs by Median Earnings
In terms of median earnings, the demographic groups most similar to Assyrians/Chaldeans/Syriacs are Immigrants from Fiji ($48,305, a difference of 0.0%), Sierra Leonean ($48,286, a difference of 0.040%), Immigrants from Philippines ($48,266, a difference of 0.080%), Pakistani ($48,254, a difference of 0.10%), and Brazilian ($48,356, a difference of 0.11%).
| Demographics | Rating | Rank | Median Earnings |
| Poles | 95.8 /100 | #119 | Exceptional $48,659 |
| Carpatho Rusyns | 95.5 /100 | #120 | Exceptional $48,617 |
| Arabs | 95.4 /100 | #121 | Exceptional $48,599 |
| Chileans | 94.8 /100 | #122 | Exceptional $48,504 |
| Immigrants | Syria | 93.9 /100 | #123 | Exceptional $48,375 |
| Brazilians | 93.7 /100 | #124 | Exceptional $48,356 |
| Immigrants | Fiji | 93.3 /100 | #125 | Exceptional $48,305 |
| Assyrians/Chaldeans/Syriacs | 93.3 /100 | #126 | Exceptional $48,304 |
| Sierra Leoneans | 93.1 /100 | #127 | Exceptional $48,286 |
| Immigrants | Philippines | 92.9 /100 | #128 | Exceptional $48,266 |
| Pakistanis | 92.8 /100 | #129 | Exceptional $48,254 |
| Zimbabweans | 92.6 /100 | #130 | Exceptional $48,229 |
| Lebanese | 92.5 /100 | #131 | Exceptional $48,226 |
| British | 92.2 /100 | #132 | Exceptional $48,189 |
| Immigrants | Uganda | 90.5 /100 | #133 | Exceptional $48,041 |
Demographics Similar to Thais by Median Earnings
In terms of median earnings, the demographic groups most similar to Thais are Immigrants from Hong Kong ($59,433, a difference of 0.33%), Immigrants from Singapore ($59,038, a difference of 0.34%), Iranian ($58,474, a difference of 1.3%), Immigrants from India ($60,648, a difference of 2.4%), and Immigrants from Iran ($57,612, a difference of 2.8%).
| Demographics | Rating | Rank | Median Earnings |
| Filipinos | 100.0 /100 | #1 | Exceptional $61,197 |
| Immigrants | Taiwan | 100.0 /100 | #2 | Exceptional $61,151 |
| Immigrants | India | 100.0 /100 | #3 | Exceptional $60,648 |
| Immigrants | Hong Kong | 100.0 /100 | #4 | Exceptional $59,433 |
| Thais | 100.0 /100 | #5 | Exceptional $59,237 |
| Immigrants | Singapore | 100.0 /100 | #6 | Exceptional $59,038 |
| Iranians | 100.0 /100 | #7 | Exceptional $58,474 |
| Immigrants | Iran | 100.0 /100 | #8 | Exceptional $57,612 |
| Okinawans | 100.0 /100 | #9 | Exceptional $57,550 |
| Immigrants | South Central Asia | 100.0 /100 | #10 | Exceptional $57,114 |
| Immigrants | Israel | 100.0 /100 | #11 | Exceptional $57,034 |
| Immigrants | Ireland | 100.0 /100 | #12 | Exceptional $56,854 |
| Immigrants | China | 100.0 /100 | #13 | Exceptional $56,638 |
| Immigrants | Australia | 100.0 /100 | #14 | Exceptional $56,305 |
| Indians (Asian) | 100.0 /100 | #15 | Exceptional $56,253 |