Assyrian/Chaldean/Syriac vs Alsatian Householder Income Under 25 years
COMPARE
Assyrian/Chaldean/Syriac
Alsatian
Householder Income Under 25 years
Householder Income Under 25 years Comparison
Assyrians/Chaldeans/Syriacs
Alsatians
$65,329
HOUSEHOLDER INCOME UNDER 25 YEARS
100.0/ 100
METRIC RATING
1st/ 347
METRIC RANK
$49,267
HOUSEHOLDER INCOME UNDER 25 YEARS
0.1/ 100
METRIC RATING
282nd/ 347
METRIC RANK
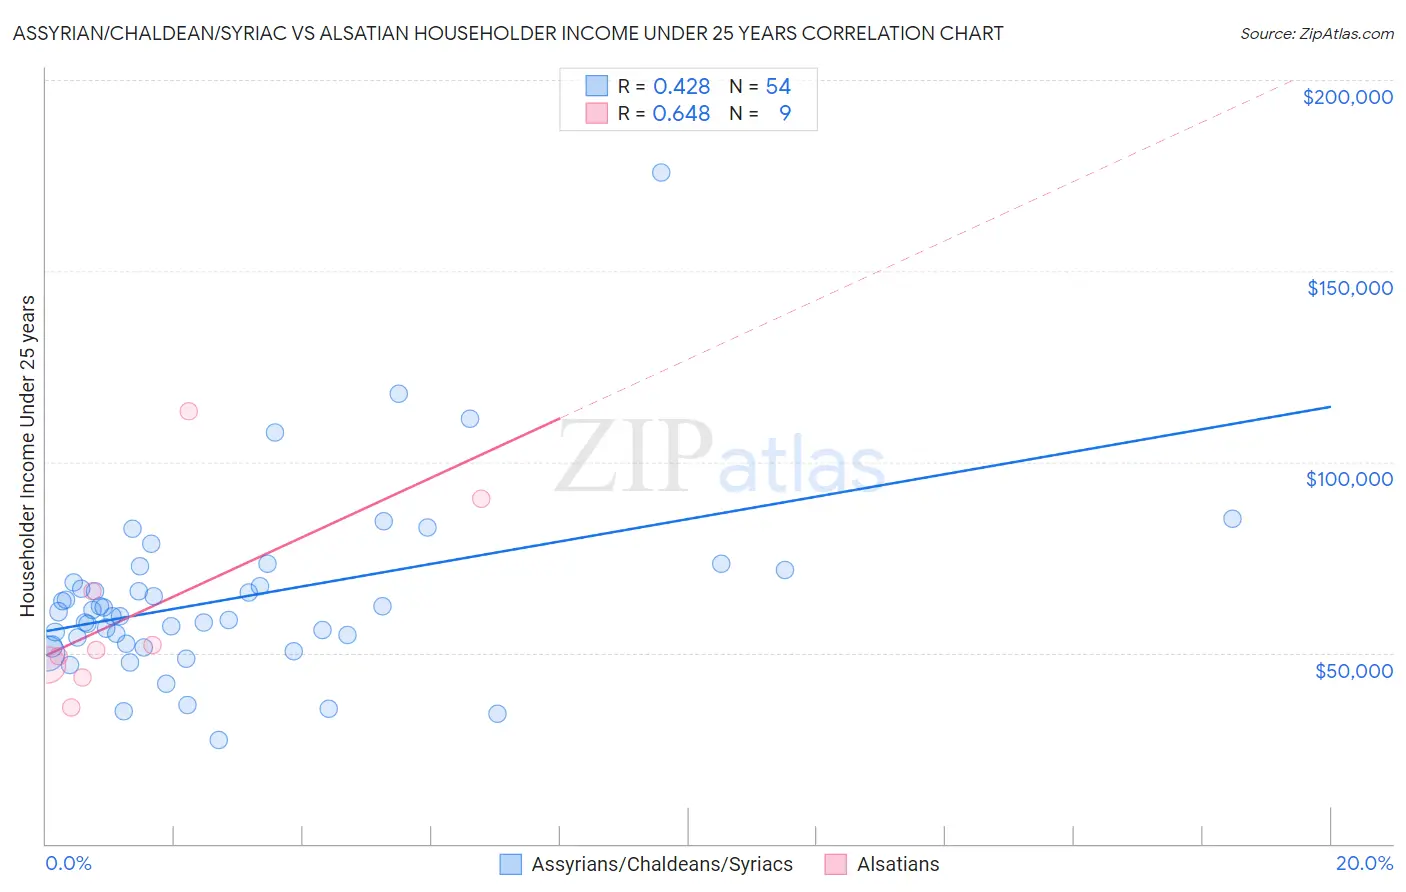
Assyrian/Chaldean/Syriac vs Alsatian Householder Income Under 25 years Correlation Chart
The statistical analysis conducted on geographies consisting of 100,770,753 people shows a moderate positive correlation between the proportion of Assyrians/Chaldeans/Syriacs and household income with householder under the age of 25 in the United States with a correlation coefficient (R) of 0.428 and weighted average of $65,329. Similarly, the statistical analysis conducted on geographies consisting of 77,564,981 people shows a significant positive correlation between the proportion of Alsatians and household income with householder under the age of 25 in the United States with a correlation coefficient (R) of 0.648 and weighted average of $49,267, a difference of 32.6%.
Householder Income Under 25 years Correlation Summary
| Measurement | Assyrian/Chaldean/Syriac | Alsatian |
| Minimum | $27,045 | $35,598 |
| Maximum | $175,865 | $113,281 |
| Range | $148,820 | $77,683 |
| Mean | $64,201 | $60,844 |
| Median | $60,126 | $50,662 |
| Interquartile 25% (IQ1) | $52,453 | $45,251 |
| Interquartile 75% (IQ3) | $68,319 | $78,194 |
| Interquartile Range (IQR) | $15,866 | $32,943 |
| Standard Deviation (Sample) | $23,487 | $25,229 |
| Standard Deviation (Population) | $23,269 | $23,786 |
Similar Demographics by Householder Income Under 25 years
Demographics Similar to Assyrians/Chaldeans/Syriacs by Householder Income Under 25 years
In terms of householder income under 25 years, the demographic groups most similar to Assyrians/Chaldeans/Syriacs are Immigrants from Hong Kong ($62,083, a difference of 5.2%), Immigrants from India ($59,914, a difference of 9.0%), Immigrants from Taiwan ($59,424, a difference of 9.9%), Immigrants from Bolivia ($59,389, a difference of 10.0%), and Thai ($59,187, a difference of 10.4%).
| Demographics | Rating | Rank | Householder Income Under 25 years |
| Assyrians/Chaldeans/Syriacs | 100.0 /100 | #1 | Exceptional $65,329 |
| Immigrants | Hong Kong | 100.0 /100 | #2 | Exceptional $62,083 |
| Immigrants | India | 100.0 /100 | #3 | Exceptional $59,914 |
| Immigrants | Taiwan | 100.0 /100 | #4 | Exceptional $59,424 |
| Immigrants | Bolivia | 100.0 /100 | #5 | Exceptional $59,389 |
| Thais | 100.0 /100 | #6 | Exceptional $59,187 |
| Bolivians | 100.0 /100 | #7 | Exceptional $58,506 |
| Indians (Asian) | 100.0 /100 | #8 | Exceptional $58,239 |
| Chinese | 100.0 /100 | #9 | Exceptional $58,162 |
| Afghans | 100.0 /100 | #10 | Exceptional $58,019 |
| Immigrants | China | 100.0 /100 | #11 | Exceptional $57,931 |
| Immigrants | Philippines | 100.0 /100 | #12 | Exceptional $57,930 |
| Immigrants | South Central Asia | 100.0 /100 | #13 | Exceptional $57,818 |
| Filipinos | 100.0 /100 | #14 | Exceptional $57,740 |
| Koreans | 100.0 /100 | #15 | Exceptional $57,730 |
Demographics Similar to Alsatians by Householder Income Under 25 years
In terms of householder income under 25 years, the demographic groups most similar to Alsatians are Nonimmigrants ($49,348, a difference of 0.16%), Immigrants from Nigeria ($49,174, a difference of 0.19%), Hmong ($49,364, a difference of 0.20%), Apache ($49,395, a difference of 0.26%), and Nigerian ($49,416, a difference of 0.30%).
| Demographics | Rating | Rank | Householder Income Under 25 years |
| Immigrants | Kenya | 0.2 /100 | #275 | Tragic $49,633 |
| Dominicans | 0.2 /100 | #276 | Tragic $49,633 |
| Immigrants | Western Africa | 0.2 /100 | #277 | Tragic $49,621 |
| Nigerians | 0.1 /100 | #278 | Tragic $49,416 |
| Apache | 0.1 /100 | #279 | Tragic $49,395 |
| Hmong | 0.1 /100 | #280 | Tragic $49,364 |
| Immigrants | Nonimmigrants | 0.1 /100 | #281 | Tragic $49,348 |
| Alsatians | 0.1 /100 | #282 | Tragic $49,267 |
| Immigrants | Nigeria | 0.1 /100 | #283 | Tragic $49,174 |
| Carpatho Rusyns | 0.1 /100 | #284 | Tragic $49,113 |
| Scotch-Irish | 0.0 /100 | #285 | Tragic $49,039 |
| French American Indians | 0.0 /100 | #286 | Tragic $48,977 |
| Senegalese | 0.0 /100 | #287 | Tragic $48,953 |
| Liberians | 0.0 /100 | #288 | Tragic $48,917 |
| Hondurans | 0.0 /100 | #289 | Tragic $48,885 |