Assyrian/Chaldean/Syriac vs Polish Householder Income Under 25 years
COMPARE
Assyrian/Chaldean/Syriac
Polish
Householder Income Under 25 years
Householder Income Under 25 years Comparison
Assyrians/Chaldeans/Syriacs
Poles
$65,329
HOUSEHOLDER INCOME UNDER 25 YEARS
100.0/ 100
METRIC RATING
1st/ 347
METRIC RANK
$52,407
HOUSEHOLDER INCOME UNDER 25 YEARS
63.0/ 100
METRIC RATING
165th/ 347
METRIC RANK
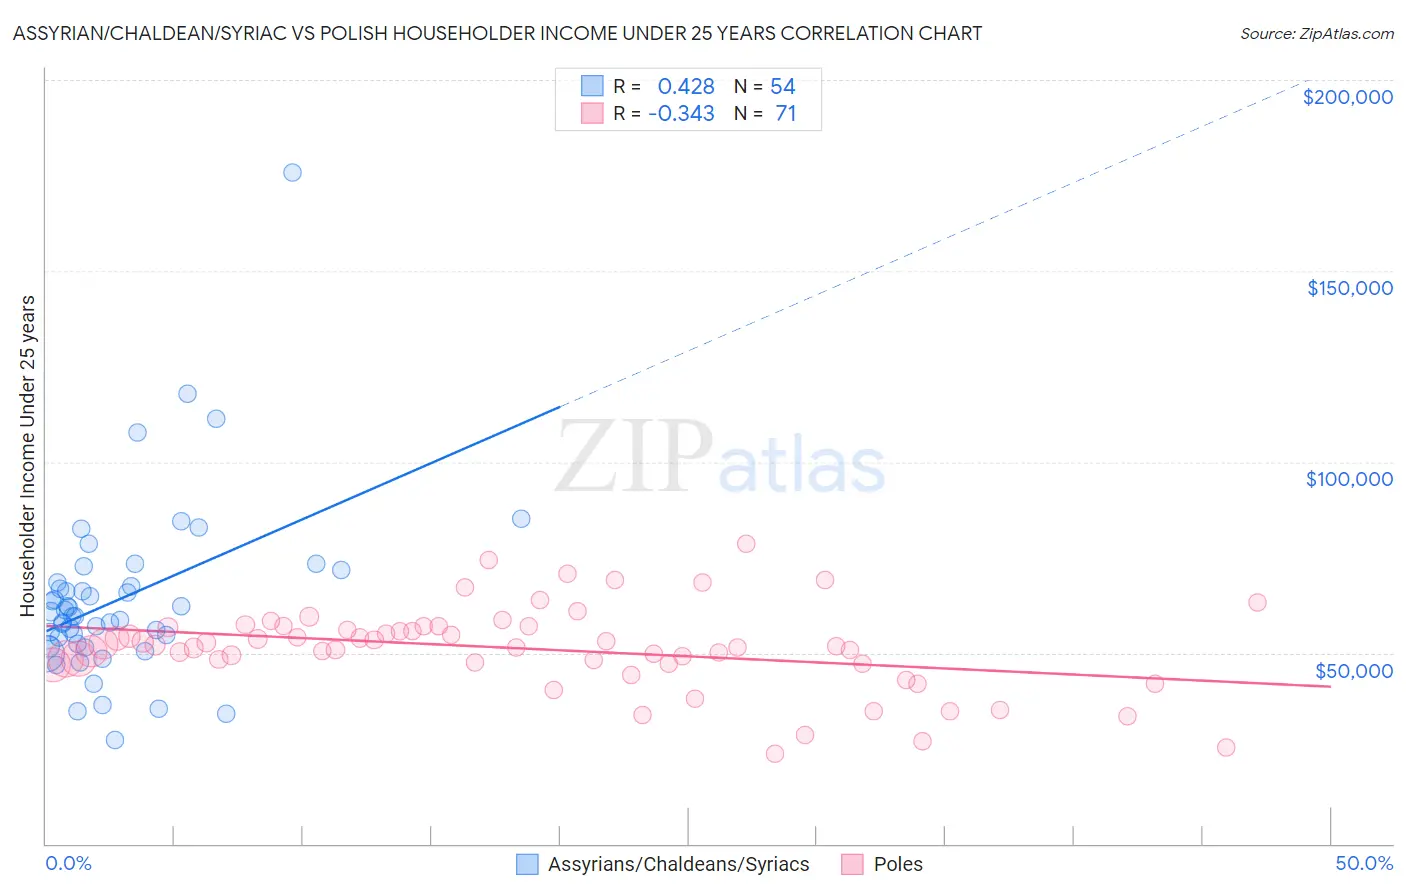
Assyrian/Chaldean/Syriac vs Polish Householder Income Under 25 years Correlation Chart
The statistical analysis conducted on geographies consisting of 100,770,753 people shows a moderate positive correlation between the proportion of Assyrians/Chaldeans/Syriacs and household income with householder under the age of 25 in the United States with a correlation coefficient (R) of 0.428 and weighted average of $65,329. Similarly, the statistical analysis conducted on geographies consisting of 433,901,695 people shows a mild negative correlation between the proportion of Poles and household income with householder under the age of 25 in the United States with a correlation coefficient (R) of -0.343 and weighted average of $52,407, a difference of 24.7%.
Householder Income Under 25 years Correlation Summary
| Measurement | Assyrian/Chaldean/Syriac | Polish |
| Minimum | $27,045 | $23,462 |
| Maximum | $175,865 | $78,571 |
| Range | $148,820 | $55,109 |
| Mean | $64,201 | $51,111 |
| Median | $60,126 | $51,592 |
| Interquartile 25% (IQ1) | $52,453 | $47,153 |
| Interquartile 75% (IQ3) | $68,319 | $56,895 |
| Interquartile Range (IQR) | $15,866 | $9,742 |
| Standard Deviation (Sample) | $23,487 | $10,979 |
| Standard Deviation (Population) | $23,269 | $10,902 |
Similar Demographics by Householder Income Under 25 years
Demographics Similar to Assyrians/Chaldeans/Syriacs by Householder Income Under 25 years
In terms of householder income under 25 years, the demographic groups most similar to Assyrians/Chaldeans/Syriacs are Immigrants from Hong Kong ($62,083, a difference of 5.2%), Immigrants from India ($59,914, a difference of 9.0%), Immigrants from Taiwan ($59,424, a difference of 9.9%), Immigrants from Bolivia ($59,389, a difference of 10.0%), and Thai ($59,187, a difference of 10.4%).
| Demographics | Rating | Rank | Householder Income Under 25 years |
| Assyrians/Chaldeans/Syriacs | 100.0 /100 | #1 | Exceptional $65,329 |
| Immigrants | Hong Kong | 100.0 /100 | #2 | Exceptional $62,083 |
| Immigrants | India | 100.0 /100 | #3 | Exceptional $59,914 |
| Immigrants | Taiwan | 100.0 /100 | #4 | Exceptional $59,424 |
| Immigrants | Bolivia | 100.0 /100 | #5 | Exceptional $59,389 |
| Thais | 100.0 /100 | #6 | Exceptional $59,187 |
| Bolivians | 100.0 /100 | #7 | Exceptional $58,506 |
| Indians (Asian) | 100.0 /100 | #8 | Exceptional $58,239 |
| Chinese | 100.0 /100 | #9 | Exceptional $58,162 |
| Afghans | 100.0 /100 | #10 | Exceptional $58,019 |
| Immigrants | China | 100.0 /100 | #11 | Exceptional $57,931 |
| Immigrants | Philippines | 100.0 /100 | #12 | Exceptional $57,930 |
| Immigrants | South Central Asia | 100.0 /100 | #13 | Exceptional $57,818 |
| Filipinos | 100.0 /100 | #14 | Exceptional $57,740 |
| Koreans | 100.0 /100 | #15 | Exceptional $57,730 |
Demographics Similar to Poles by Householder Income Under 25 years
In terms of householder income under 25 years, the demographic groups most similar to Poles are Immigrants from Austria ($52,400, a difference of 0.010%), Immigrants from Chile ($52,440, a difference of 0.060%), Immigrants from Trinidad and Tobago ($52,437, a difference of 0.060%), Immigrants from Uganda ($52,374, a difference of 0.060%), and Immigrants from Cambodia ($52,450, a difference of 0.080%).
| Demographics | Rating | Rank | Householder Income Under 25 years |
| Immigrants | Netherlands | 72.8 /100 | #158 | Good $52,592 |
| Mongolians | 70.2 /100 | #159 | Good $52,540 |
| Immigrants | Turkey | 68.3 /100 | #160 | Good $52,503 |
| Uruguayans | 66.2 /100 | #161 | Good $52,465 |
| Immigrants | Cambodia | 65.4 /100 | #162 | Good $52,450 |
| Immigrants | Chile | 64.8 /100 | #163 | Good $52,440 |
| Immigrants | Trinidad and Tobago | 64.7 /100 | #164 | Good $52,437 |
| Poles | 63.0 /100 | #165 | Good $52,407 |
| Immigrants | Austria | 62.6 /100 | #166 | Good $52,400 |
| Immigrants | Uganda | 61.1 /100 | #167 | Good $52,374 |
| Japanese | 60.5 /100 | #168 | Good $52,365 |
| Canadians | 58.8 /100 | #169 | Average $52,336 |
| Israelis | 58.8 /100 | #170 | Average $52,335 |
| Immigrants | Uruguay | 56.8 /100 | #171 | Average $52,302 |
| Cypriots | 51.2 /100 | #172 | Average $52,209 |