Assyrian/Chaldean/Syriac vs Portuguese Householder Income Under 25 years
COMPARE
Assyrian/Chaldean/Syriac
Portuguese
Householder Income Under 25 years
Householder Income Under 25 years Comparison
Assyrians/Chaldeans/Syriacs
Portuguese
$65,329
HOUSEHOLDER INCOME UNDER 25 YEARS
100.0/ 100
METRIC RATING
1st/ 347
METRIC RANK
$54,436
HOUSEHOLDER INCOME UNDER 25 YEARS
99.6/ 100
METRIC RATING
81st/ 347
METRIC RANK
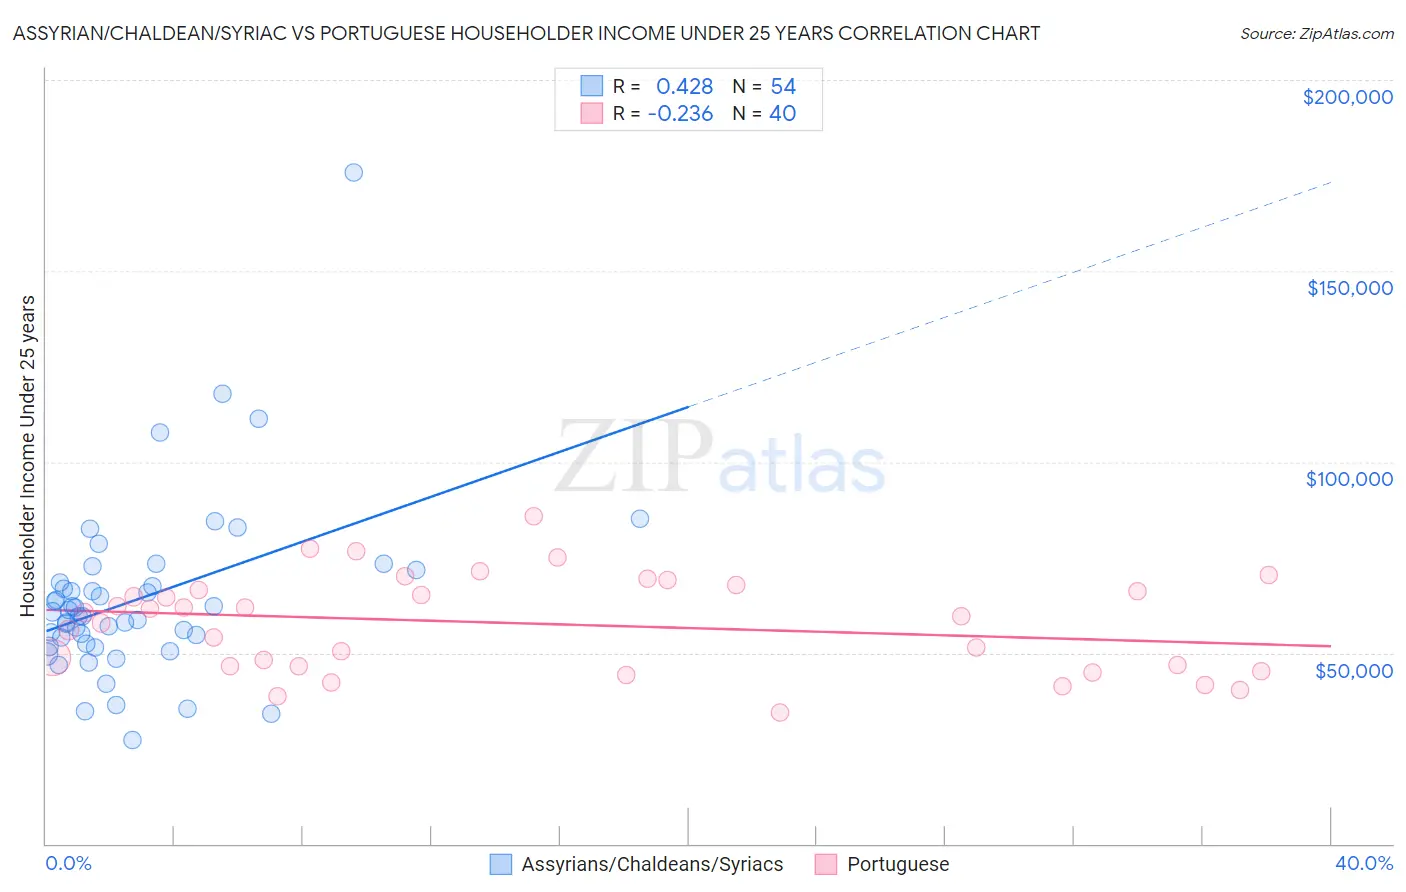
Assyrian/Chaldean/Syriac vs Portuguese Householder Income Under 25 years Correlation Chart
The statistical analysis conducted on geographies consisting of 100,770,753 people shows a moderate positive correlation between the proportion of Assyrians/Chaldeans/Syriacs and household income with householder under the age of 25 in the United States with a correlation coefficient (R) of 0.428 and weighted average of $65,329. Similarly, the statistical analysis conducted on geographies consisting of 369,014,384 people shows a weak negative correlation between the proportion of Portuguese and household income with householder under the age of 25 in the United States with a correlation coefficient (R) of -0.236 and weighted average of $54,436, a difference of 20.0%.
Householder Income Under 25 years Correlation Summary
| Measurement | Assyrian/Chaldean/Syriac | Portuguese |
| Minimum | $27,045 | $34,350 |
| Maximum | $175,865 | $85,677 |
| Range | $148,820 | $51,327 |
| Mean | $64,201 | $57,647 |
| Median | $60,126 | $60,100 |
| Interquartile 25% (IQ1) | $52,453 | $46,553 |
| Interquartile 75% (IQ3) | $68,319 | $67,025 |
| Interquartile Range (IQR) | $15,866 | $20,472 |
| Standard Deviation (Sample) | $23,487 | $12,592 |
| Standard Deviation (Population) | $23,269 | $12,434 |
Similar Demographics by Householder Income Under 25 years
Demographics Similar to Assyrians/Chaldeans/Syriacs by Householder Income Under 25 years
In terms of householder income under 25 years, the demographic groups most similar to Assyrians/Chaldeans/Syriacs are Immigrants from Hong Kong ($62,083, a difference of 5.2%), Immigrants from India ($59,914, a difference of 9.0%), Immigrants from Taiwan ($59,424, a difference of 9.9%), Immigrants from Bolivia ($59,389, a difference of 10.0%), and Thai ($59,187, a difference of 10.4%).
| Demographics | Rating | Rank | Householder Income Under 25 years |
| Assyrians/Chaldeans/Syriacs | 100.0 /100 | #1 | Exceptional $65,329 |
| Immigrants | Hong Kong | 100.0 /100 | #2 | Exceptional $62,083 |
| Immigrants | India | 100.0 /100 | #3 | Exceptional $59,914 |
| Immigrants | Taiwan | 100.0 /100 | #4 | Exceptional $59,424 |
| Immigrants | Bolivia | 100.0 /100 | #5 | Exceptional $59,389 |
| Thais | 100.0 /100 | #6 | Exceptional $59,187 |
| Bolivians | 100.0 /100 | #7 | Exceptional $58,506 |
| Indians (Asian) | 100.0 /100 | #8 | Exceptional $58,239 |
| Chinese | 100.0 /100 | #9 | Exceptional $58,162 |
| Afghans | 100.0 /100 | #10 | Exceptional $58,019 |
| Immigrants | China | 100.0 /100 | #11 | Exceptional $57,931 |
| Immigrants | Philippines | 100.0 /100 | #12 | Exceptional $57,930 |
| Immigrants | South Central Asia | 100.0 /100 | #13 | Exceptional $57,818 |
| Filipinos | 100.0 /100 | #14 | Exceptional $57,740 |
| Koreans | 100.0 /100 | #15 | Exceptional $57,730 |
Demographics Similar to Portuguese by Householder Income Under 25 years
In terms of householder income under 25 years, the demographic groups most similar to Portuguese are Egyptian ($54,444, a difference of 0.010%), Immigrants from Italy ($54,449, a difference of 0.020%), Nepalese ($54,472, a difference of 0.060%), Immigrants from Brazil ($54,487, a difference of 0.090%), and Immigrants from Southern Europe ($54,484, a difference of 0.090%).
| Demographics | Rating | Rank | Householder Income Under 25 years |
| Immigrants | Grenada | 99.7 /100 | #74 | Exceptional $54,538 |
| Immigrants | Sri Lanka | 99.7 /100 | #75 | Exceptional $54,512 |
| Immigrants | Brazil | 99.6 /100 | #76 | Exceptional $54,487 |
| Immigrants | Southern Europe | 99.6 /100 | #77 | Exceptional $54,484 |
| Nepalese | 99.6 /100 | #78 | Exceptional $54,472 |
| Immigrants | Italy | 99.6 /100 | #79 | Exceptional $54,449 |
| Egyptians | 99.6 /100 | #80 | Exceptional $54,444 |
| Portuguese | 99.6 /100 | #81 | Exceptional $54,436 |
| Russians | 99.5 /100 | #82 | Exceptional $54,389 |
| Laotians | 99.5 /100 | #83 | Exceptional $54,369 |
| Bulgarians | 99.5 /100 | #84 | Exceptional $54,352 |
| Immigrants | Czechoslovakia | 99.5 /100 | #85 | Exceptional $54,352 |
| Immigrants | Croatia | 99.5 /100 | #86 | Exceptional $54,343 |
| Brazilians | 99.5 /100 | #87 | Exceptional $54,335 |
| Yakama | 99.5 /100 | #88 | Exceptional $54,321 |