Assyrian/Chaldean/Syriac vs Hawaiian Householder Income Under 25 years

COMPARE

Assyrian/Chaldean/Syriac
Race
Ancestry
AfghanAfricanAlaska NativeAlaskan AthabascanAlbanianAleutAlsatianAmericanApacheArabArapahoArgentineanArmenianAssyrian/Chaldean/SyriacAustralianAustrianBahamianBangladeshiBarbadianBasqueBelgianBelizeanBermudanBhutaneseBlackfeetBolivianBrazilianBritishBritish West IndianBulgarianBurmeseCajunCambodianCanadianCape VerdeanCarpatho RusynCelticCentral AmericanCentral American IndianCherokeeCheyenneChickasawChileanChineseChippewaChoctawColombianColvilleComancheCosta RicanCreeCreekCroatianCrowCubanCypriotCzechCzechoslovakianDanishDelawareDominicanDutchDutch West IndianEastern EuropeanEcuadorianEgyptianEnglishEstonianEthiopianEuropeanFijianFilipinoFinnishFrenchFrench American IndianFrench CanadianGermanGerman RussianGhanaianGreekGuamanian/ChamorroGuatemalanGuyaneseHaitianHmongHonduranHopiHoumaHungarianIcelanderIndian (Asian)IndonesianInupiatIranianIraqiIrishIroquoisIsraeliItalianJamaicanJapaneseJordanianKenyanKiowaKoreanLaotianLatvianLebaneseLiberianLithuanianLumbeeLuxembourgerMacedonianMalaysianMalteseMarshalleseMenomineeMexicanMexican American IndianMongolianMoroccanNative HawaiianNavajoNepaleseNew ZealanderNicaraguanNigerianNorthern EuropeanNorwegianOkinawanOsageOttawaPaiutePakistaniPalestinianPanamanianParaguayanPennsylvania GermanPeruvianPimaPolishPortuguesePotawatomiPuebloPuerto RicanPuget Sound SalishRomanianRussianSalvadoranSamoanScandinavianScotch-IrishScottishSeminoleSenegaleseSerbianShoshoneSierra LeoneanSiouxSlavicSlovakSloveneSomaliSouth AfricanSouth AmericanSouth American IndianSoviet UnionSpaniardSpanishSpanish AmericanSpanish American IndianSri LankanSubsaharan AfricanSudaneseSwedishSwissSyrianTaiwaneseThaiTlingit-HaidaTohono O'OdhamTonganTrinidadian and TobagonianTsimshianTurkishU.S. Virgin IslanderUgandanUkrainianUruguayanUteVenezuelanVietnameseWelshWest IndianYakamaYaquiYugoslavianYumanYup'ikZimbabwean
Immigration
NonimmigrantsImmigrantsAfghanistanAfricaAlbaniaArgentinaArmeniaAsiaAustraliaAustriaBahamasBangladeshBarbadosBelarusBelgiumBelizeBoliviaBosnia and HerzegovinaBrazilBulgariaBurma/MyanmarCabo VerdeCambodiaCameroonCanadaCaribbeanCentral AmericaChileChinaColombiaCongoCosta RicaCroatiaCubaCzechoslovakiaDenmarkDominicaDominican RepublicEastern AfricaEastern AsiaEastern EuropeEcuadorEgyptEl SalvadorEnglandEritreaEthiopiaEuropeFijiFranceGermanyGhanaGreeceGrenadaGuatemalaGuyanaHaitiHondurasHong KongHungaryIndiaIndonesiaIranIraqIrelandIsraelItalyJamaicaJapanJordanKazakhstanKenyaKoreaKuwaitLaosLatin AmericaLatviaLebanonLiberiaLithuaniaMalaysiaMexicoMicronesiaMiddle AfricaMoldovaMoroccoNepalNetherlandsNicaraguaNigeriaNorth AmericaNorth MacedoniaNorthern AfricaNorthern EuropeNorwayOceaniaPakistanPanamaPeruPhilippinesPolandPortugalRomaniaRussiaSaudi ArabiaScotlandSenegalSerbiaSierra LeoneSingaporeSomaliaSouth AfricaSouth AmericaSouth Central AsiaSouth Eastern AsiaSouthern EuropeSpainSri LankaSt. Vincent and the GrenadinesSudanSwedenSwitzerlandSyriaTaiwanThailandTrinidad and TobagoTurkeyUgandaUkraineUruguayUzbekistanVenezuelaVietnamWest IndiesWestern AfricaWestern AsiaWestern EuropeYemenZaireZimbabweAzores
Hawaiian
Race
Ancestry
AfghanAfricanAlaska NativeAlaskan AthabascanAlbanianAleutAlsatianAmericanApacheArabArapahoArgentineanArmenianAustralianAustrianBahamianBangladeshiBarbadianBasqueBelgianBelizeanBermudanBhutaneseBlackfeetBolivianBrazilianBritishBritish West IndianBulgarianBurmeseCajunCambodianCanadianCape VerdeanCarpatho RusynCelticCentral AmericanCentral American IndianCherokeeCheyenneChickasawChileanChineseChippewaChoctawColombianColvilleComancheCosta RicanCreeCreekCroatianCrowCubanCypriotCzechCzechoslovakianDanishDelawareDominicanDutchDutch West IndianEastern EuropeanEcuadorianEgyptianEnglishEstonianEthiopianEuropeanFijianFilipinoFinnishFrenchFrench American IndianFrench CanadianGermanGerman RussianGhanaianGreekGuamanian/ChamorroGuatemalanGuyaneseHaitianHmongHonduranHopiHoumaHungarianIcelanderIndian (Asian)IndonesianInupiatIranianIraqiIrishIroquoisIsraeliItalianJamaicanJapaneseJordanianKenyanKiowaKoreanLaotianLatvianLebaneseLiberianLithuanianLumbeeLuxembourgerMacedonianMalaysianMalteseMarshalleseMenomineeMexicanMexican American IndianMongolianMoroccanNative HawaiianNavajoNepaleseNew ZealanderNicaraguanNigerianNorthern EuropeanNorwegianOkinawanOsageOttawaPaiutePakistaniPalestinianPanamanianParaguayanPennsylvania GermanPeruvianPimaPolishPortuguesePotawatomiPuebloPuerto RicanPuget Sound SalishRomanianRussianSalvadoranSamoanScandinavianScotch-IrishScottishSeminoleSenegaleseSerbianShoshoneSierra LeoneanSiouxSlavicSlovakSloveneSomaliSouth AfricanSouth AmericanSouth American IndianSoviet UnionSpaniardSpanishSpanish AmericanSpanish American IndianSri LankanSubsaharan AfricanSudaneseSwedishSwissSyrianTaiwaneseThaiTlingit-HaidaTohono O'OdhamTonganTrinidadian and TobagonianTsimshianTurkishU.S. Virgin IslanderUgandanUkrainianUruguayanUteVenezuelanVietnameseWelshWest IndianYakamaYaquiYugoslavianYumanYup'ikZimbabwean
Immigration
NonimmigrantsImmigrantsAfghanistanAfricaAlbaniaArgentinaArmeniaAsiaAustraliaAustriaBahamasBangladeshBarbadosBelarusBelgiumBelizeBoliviaBosnia and HerzegovinaBrazilBulgariaBurma/MyanmarCabo VerdeCambodiaCameroonCanadaCaribbeanCentral AmericaChileChinaColombiaCongoCosta RicaCroatiaCubaCzechoslovakiaDenmarkDominicaDominican RepublicEastern AfricaEastern AsiaEastern EuropeEcuadorEgyptEl SalvadorEnglandEritreaEthiopiaEuropeFijiFranceGermanyGhanaGreeceGrenadaGuatemalaGuyanaHaitiHondurasHong KongHungaryIndiaIndonesiaIranIraqIrelandIsraelItalyJamaicaJapanJordanKazakhstanKenyaKoreaKuwaitLaosLatin AmericaLatviaLebanonLiberiaLithuaniaMalaysiaMexicoMicronesiaMiddle AfricaMoldovaMoroccoNepalNetherlandsNicaraguaNigeriaNorth AmericaNorth MacedoniaNorthern AfricaNorthern EuropeNorwayOceaniaPakistanPanamaPeruPhilippinesPolandPortugalRomaniaRussiaSaudi ArabiaScotlandSenegalSerbiaSierra LeoneSingaporeSomaliaSouth AfricaSouth AmericaSouth Central AsiaSouth Eastern AsiaSouthern EuropeSpainSri LankaSt. Vincent and the GrenadinesSudanSwedenSwitzerlandSyriaTaiwanThailandTrinidad and TobagoTurkeyUgandaUkraineUruguayUzbekistanVenezuelaVietnamWest IndiesWestern AfricaWestern AsiaWestern EuropeYemenZaireZimbabweAzores
Householder Income Under 25 years
Income
Poverty
Unemployment
Labor Participation
Family Structure
Vehicle Availability
Education Level
Disability

Householder Income Under 25 years Comparison

Assyrians/Chaldeans/Syriacs

Hawaiians

Exceptional
Excellent
$65,329
HOUSEHOLDER INCOME UNDER 25 YEARS
100.0/ 100
METRIC RATING
1st/ 347
METRIC RANK
$53,078
HOUSEHOLDER INCOME UNDER 25 YEARS
89.8/ 100
METRIC RATING
140th/ 347
METRIC RANK

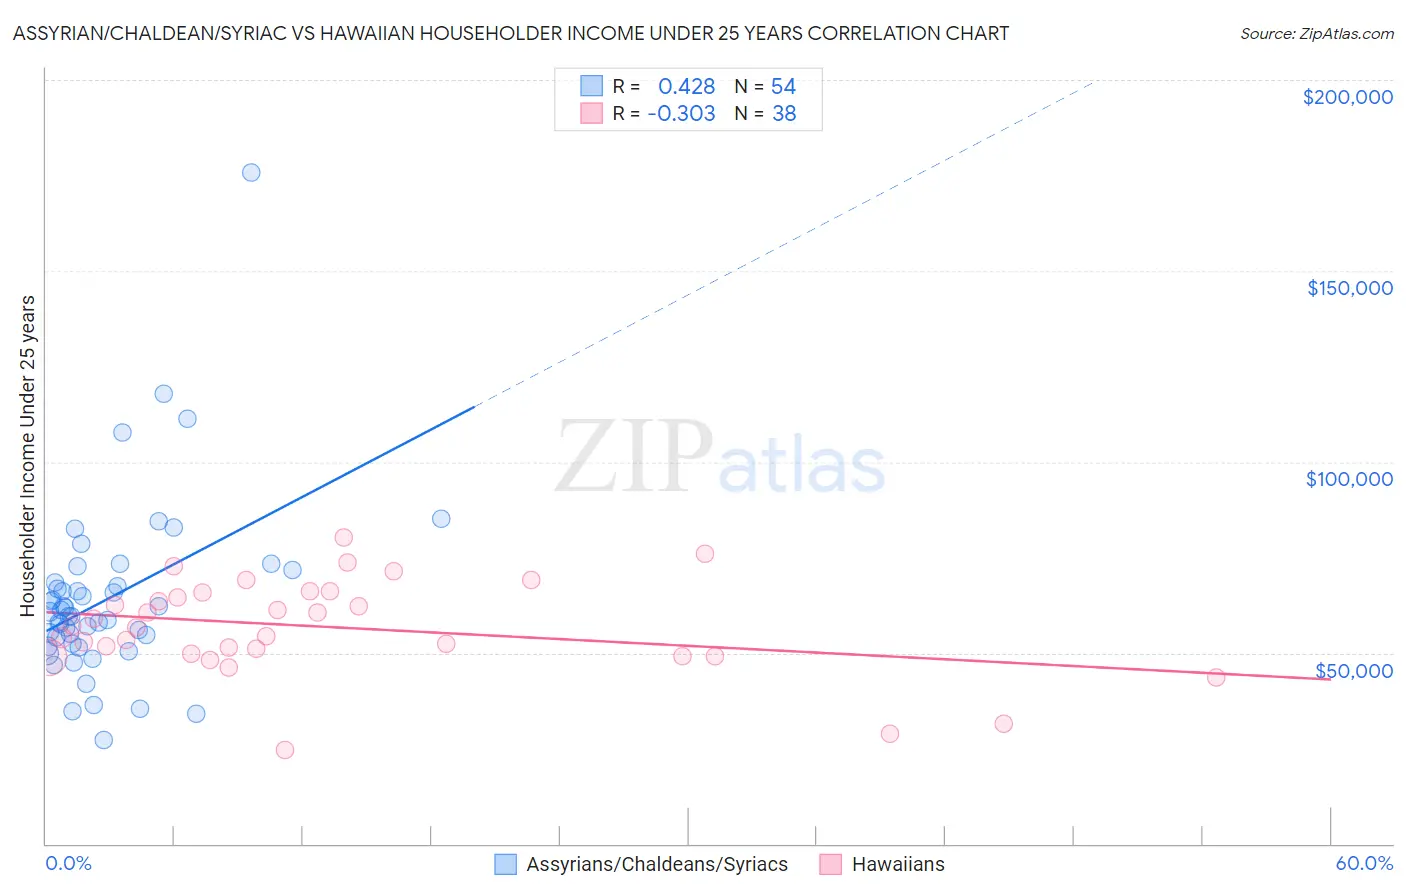
Assyrian/Chaldean/Syriac vs Hawaiian Householder Income Under 25 years Correlation Chart

The statistical analysis conducted on geographies consisting of 100,770,753 people shows a moderate positive correlation between the proportion of Assyrians/Chaldeans/Syriacs and household income with householder under the age of 25 in the United States with a correlation coefficient (R) of 0.428 and weighted average of $65,329. Similarly, the statistical analysis conducted on geographies consisting of 288,171,696 people shows a mild negative correlation between the proportion of Hawaiians and household income with householder under the age of 25 in the United States with a correlation coefficient (R) of -0.303 and weighted average of $53,078, a difference of 23.1%.
Assyrian/Chaldean/Syriac vs Hawaiian Householder Income Under 25 years

Householder Income Under 25 years Correlation Summary

MeasurementAssyrian/Chaldean/SyriacHawaiian
Minimum$27,045$24,709
Maximum$175,865$80,098
Range$148,820$55,389
Mean$64,201$56,783
Median$60,126$56,779
Interquartile 25% (IQ1)$52,453$49,786
Interquartile 75% (IQ3)$68,319$65,721
Interquartile Range (IQR)$15,866$15,935
Standard Deviation (Sample)$23,487$12,327
Standard Deviation (Population)$23,269$12,164

Similar Demographics by Householder Income Under 25 years

Demographics Similar to Assyrians/Chaldeans/Syriacs by Householder Income Under 25 years

In terms of householder income under 25 years, the demographic groups most similar to Assyrians/Chaldeans/Syriacs are Immigrants from Hong Kong ($62,083, a difference of 5.2%), Immigrants from India ($59,914, a difference of 9.0%), Immigrants from Taiwan ($59,424, a difference of 9.9%), Immigrants from Bolivia ($59,389, a difference of 10.0%), and Thai ($59,187, a difference of 10.4%).
DemographicsRating | RankHouseholder Income Under 25 years
Assyrians/Chaldeans/Syriacs
100.0
/100
|
#1
Exceptional
$65,329
Immigrants | Hong Kong
100.0
/100
|
#2
Exceptional
$62,083
Immigrants | India
100.0
/100
|
#3
Exceptional
$59,914
Immigrants | Taiwan
100.0
/100
|
#4
Exceptional
$59,424
Immigrants | Bolivia
100.0
/100
|
#5
Exceptional
$59,389
Thais
100.0
/100
|
#6
Exceptional
$59,187
Bolivians
100.0
/100
|
#7
Exceptional
$58,506
Indians (Asian)
100.0
/100
|
#8
Exceptional
$58,239
Chinese
100.0
/100
|
#9
Exceptional
$58,162
Afghans
100.0
/100
|
#10
Exceptional
$58,019
Immigrants | China
100.0
/100
|
#11
Exceptional
$57,931
Immigrants | Philippines
100.0
/100
|
#12
Exceptional
$57,930
Immigrants | South Central Asia
100.0
/100
|
#13
Exceptional
$57,818
Filipinos
100.0
/100
|
#14
Exceptional
$57,740
Koreans
100.0
/100
|
#15
Exceptional
$57,730

Demographics Similar to Hawaiians by Householder Income Under 25 years

In terms of householder income under 25 years, the demographic groups most similar to Hawaiians are Costa Rican ($53,106, a difference of 0.050%), Danish ($53,041, a difference of 0.070%), Norwegian ($53,127, a difference of 0.090%), Immigrants from Barbados ($53,163, a difference of 0.16%), and Immigrants from Armenia ($52,986, a difference of 0.17%).
DemographicsRating | RankHouseholder Income Under 25 years
Immigrants | Immigrants
92.2
/100
|
#133
Exceptional
$53,201
Immigrants | Northern Africa
91.9
/100
|
#134
Exceptional
$53,185
Chileans
91.9
/100
|
#135
Exceptional
$53,185
Armenians
91.8
/100
|
#136
Exceptional
$53,179
Immigrants | Barbados
91.5
/100
|
#137
Exceptional
$53,163
Norwegians
90.8
/100
|
#138
Exceptional
$53,127
Costa Ricans
90.4
/100
|
#139
Exceptional
$53,106
Hawaiians
89.8
/100
|
#140
Excellent
$53,078
Danes
88.9
/100
|
#141
Excellent
$53,041
Immigrants | Armenia
87.5
/100
|
#142
Excellent
$52,986
Swedes
87.5
/100
|
#143
Excellent
$52,986
South American Indians
87.3
/100
|
#144
Excellent
$52,979
Immigrants | Western Europe
86.7
/100
|
#145
Excellent
$52,957
Immigrants | Hungary
81.6
/100
|
#146
Excellent
$52,798
Latvians
81.0
/100
|
#147
Excellent
$52,783