Assyrian/Chaldean/Syriac vs Haitian Householder Income Under 25 years
COMPARE
Assyrian/Chaldean/Syriac
Haitian
Householder Income Under 25 years
Householder Income Under 25 years Comparison
Assyrians/Chaldeans/Syriacs
Haitians
$65,329
HOUSEHOLDER INCOME UNDER 25 YEARS
100.0/ 100
METRIC RATING
1st/ 347
METRIC RANK
$50,231
HOUSEHOLDER INCOME UNDER 25 YEARS
0.8/ 100
METRIC RATING
262nd/ 347
METRIC RANK
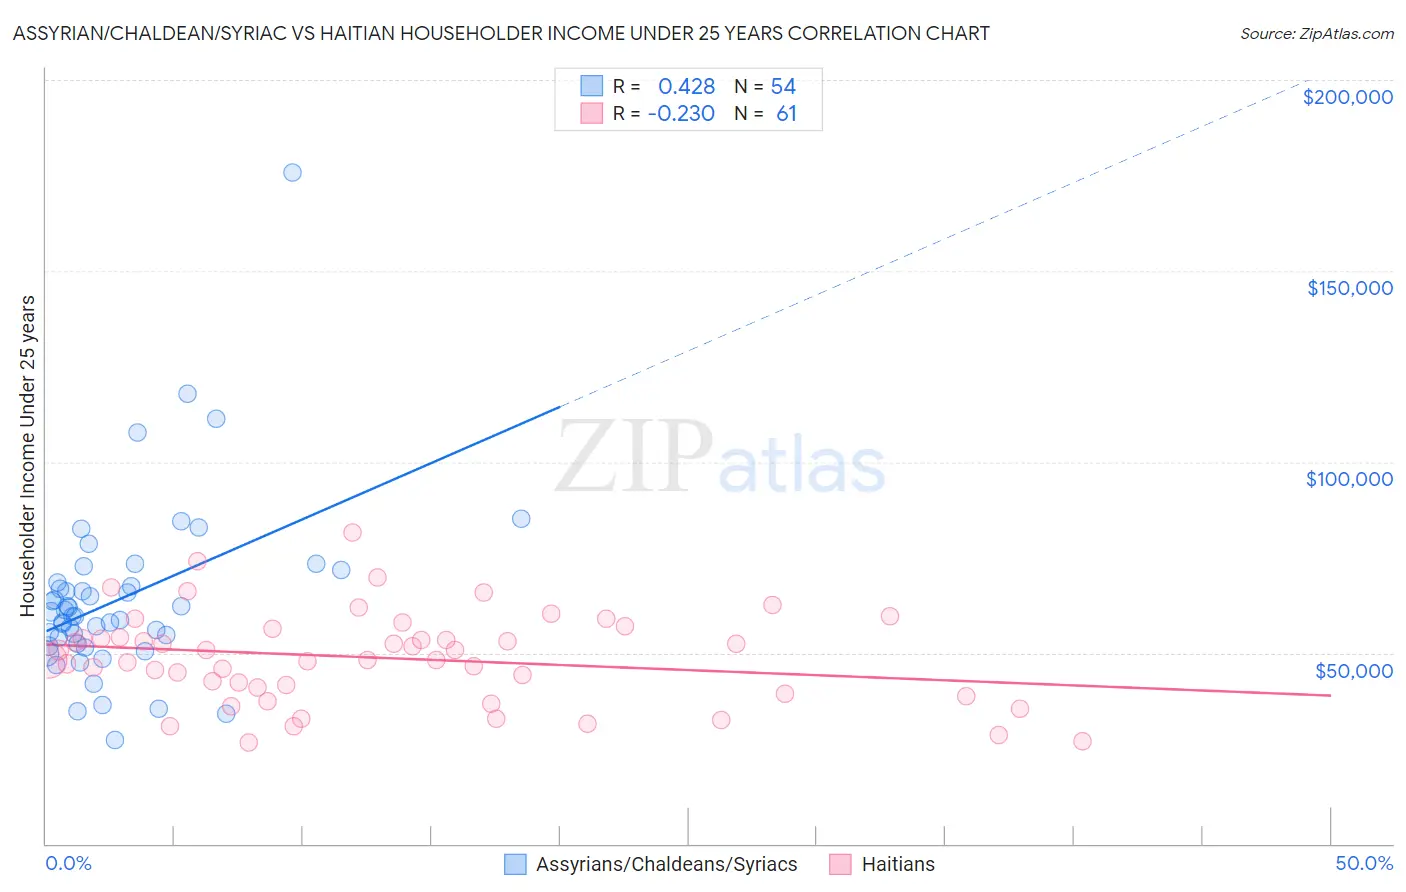
Assyrian/Chaldean/Syriac vs Haitian Householder Income Under 25 years Correlation Chart
The statistical analysis conducted on geographies consisting of 100,770,753 people shows a moderate positive correlation between the proportion of Assyrians/Chaldeans/Syriacs and household income with householder under the age of 25 in the United States with a correlation coefficient (R) of 0.428 and weighted average of $65,329. Similarly, the statistical analysis conducted on geographies consisting of 247,862,749 people shows a weak negative correlation between the proportion of Haitians and household income with householder under the age of 25 in the United States with a correlation coefficient (R) of -0.230 and weighted average of $50,231, a difference of 30.1%.
Householder Income Under 25 years Correlation Summary
| Measurement | Assyrian/Chaldean/Syriac | Haitian |
| Minimum | $27,045 | $26,478 |
| Maximum | $175,865 | $81,415 |
| Range | $148,820 | $54,938 |
| Mean | $64,201 | $48,683 |
| Median | $60,126 | $48,098 |
| Interquartile 25% (IQ1) | $52,453 | $40,094 |
| Interquartile 75% (IQ3) | $68,319 | $55,303 |
| Interquartile Range (IQR) | $15,866 | $15,209 |
| Standard Deviation (Sample) | $23,487 | $11,920 |
| Standard Deviation (Population) | $23,269 | $11,822 |
Similar Demographics by Householder Income Under 25 years
Demographics Similar to Assyrians/Chaldeans/Syriacs by Householder Income Under 25 years
In terms of householder income under 25 years, the demographic groups most similar to Assyrians/Chaldeans/Syriacs are Immigrants from Hong Kong ($62,083, a difference of 5.2%), Immigrants from India ($59,914, a difference of 9.0%), Immigrants from Taiwan ($59,424, a difference of 9.9%), Immigrants from Bolivia ($59,389, a difference of 10.0%), and Thai ($59,187, a difference of 10.4%).
| Demographics | Rating | Rank | Householder Income Under 25 years |
| Assyrians/Chaldeans/Syriacs | 100.0 /100 | #1 | Exceptional $65,329 |
| Immigrants | Hong Kong | 100.0 /100 | #2 | Exceptional $62,083 |
| Immigrants | India | 100.0 /100 | #3 | Exceptional $59,914 |
| Immigrants | Taiwan | 100.0 /100 | #4 | Exceptional $59,424 |
| Immigrants | Bolivia | 100.0 /100 | #5 | Exceptional $59,389 |
| Thais | 100.0 /100 | #6 | Exceptional $59,187 |
| Bolivians | 100.0 /100 | #7 | Exceptional $58,506 |
| Indians (Asian) | 100.0 /100 | #8 | Exceptional $58,239 |
| Chinese | 100.0 /100 | #9 | Exceptional $58,162 |
| Afghans | 100.0 /100 | #10 | Exceptional $58,019 |
| Immigrants | China | 100.0 /100 | #11 | Exceptional $57,931 |
| Immigrants | Philippines | 100.0 /100 | #12 | Exceptional $57,930 |
| Immigrants | South Central Asia | 100.0 /100 | #13 | Exceptional $57,818 |
| Filipinos | 100.0 /100 | #14 | Exceptional $57,740 |
| Koreans | 100.0 /100 | #15 | Exceptional $57,730 |
Demographics Similar to Haitians by Householder Income Under 25 years
In terms of householder income under 25 years, the demographic groups most similar to Haitians are Hungarian ($50,247, a difference of 0.030%), Immigrants from Dominican Republic ($50,204, a difference of 0.050%), Hispanic or Latino ($50,279, a difference of 0.10%), Immigrants from Dominica ($50,301, a difference of 0.14%), and Fijian ($50,132, a difference of 0.20%).
| Demographics | Rating | Rank | Householder Income Under 25 years |
| Aleuts | 1.2 /100 | #255 | Tragic $50,377 |
| Immigrants | Cuba | 1.2 /100 | #256 | Tragic $50,374 |
| Lebanese | 1.1 /100 | #257 | Tragic $50,355 |
| Whites/Caucasians | 1.1 /100 | #258 | Tragic $50,336 |
| Immigrants | Dominica | 1.0 /100 | #259 | Tragic $50,301 |
| Hispanics or Latinos | 0.9 /100 | #260 | Tragic $50,279 |
| Hungarians | 0.9 /100 | #261 | Tragic $50,247 |
| Haitians | 0.8 /100 | #262 | Tragic $50,231 |
| Immigrants | Dominican Republic | 0.8 /100 | #263 | Tragic $50,204 |
| Fijians | 0.6 /100 | #264 | Tragic $50,132 |
| Belgians | 0.6 /100 | #265 | Tragic $50,113 |
| Immigrants | Venezuela | 0.6 /100 | #266 | Tragic $50,109 |
| Immigrants | Laos | 0.5 /100 | #267 | Tragic $50,041 |
| Venezuelans | 0.5 /100 | #268 | Tragic $50,011 |
| Ute | 0.5 /100 | #269 | Tragic $49,997 |