Assyrian/Chaldean/Syriac vs Immigrants from Bolivia Median Female Earnings
COMPARE
Assyrian/Chaldean/Syriac
Immigrants from Bolivia
Median Female Earnings
Median Female Earnings Comparison
Assyrians/Chaldeans/Syriacs
Immigrants from Bolivia
$39,159
MEDIAN FEMALE EARNINGS
24.6/ 100
METRIC RATING
197th/ 347
METRIC RANK
$43,467
MEDIAN FEMALE EARNINGS
100.0/ 100
METRIC RATING
46th/ 347
METRIC RANK
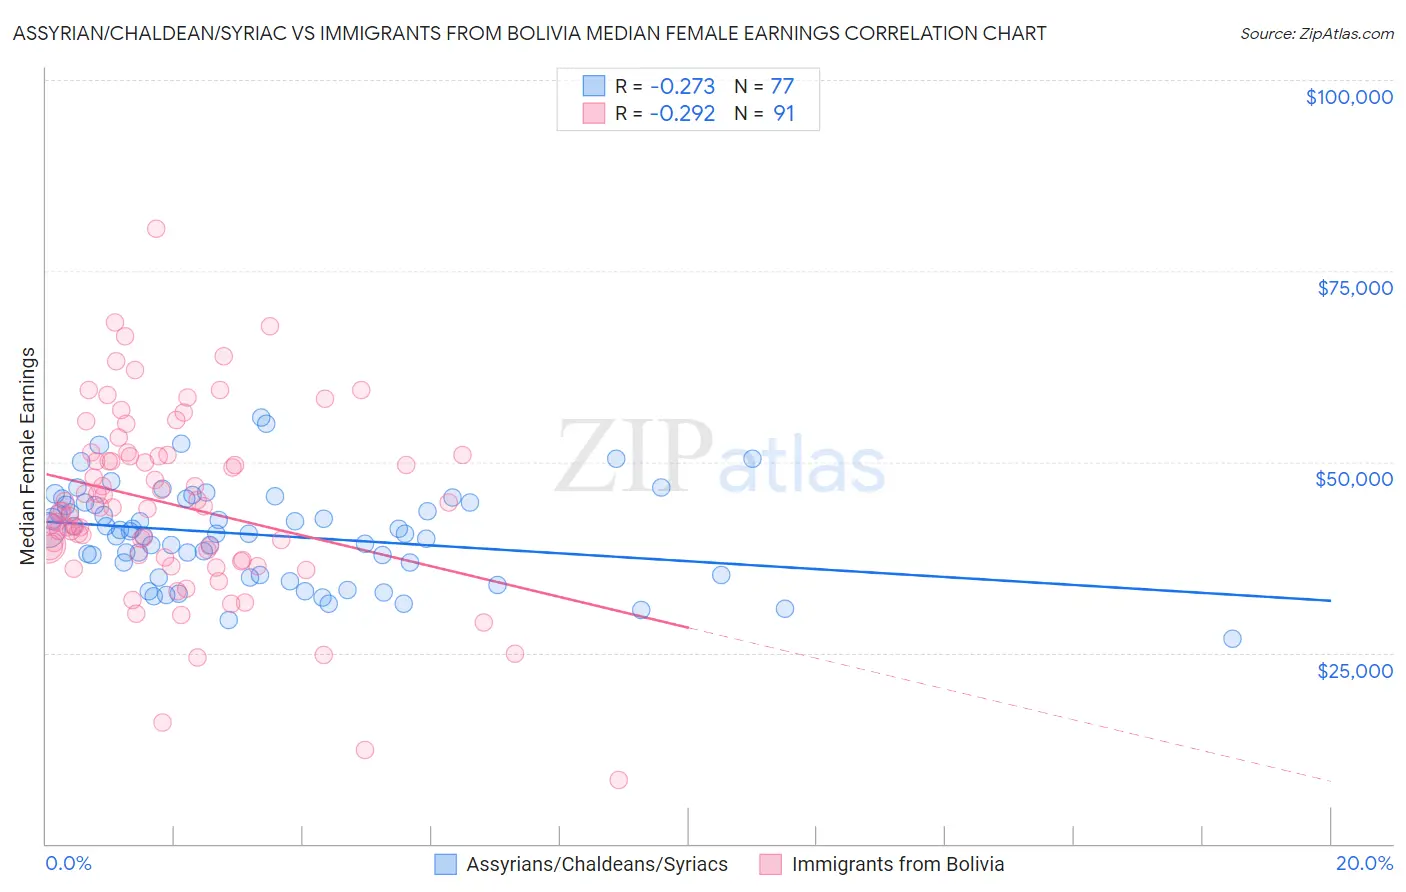
Assyrian/Chaldean/Syriac vs Immigrants from Bolivia Median Female Earnings Correlation Chart
The statistical analysis conducted on geographies consisting of 110,265,934 people shows a weak negative correlation between the proportion of Assyrians/Chaldeans/Syriacs and median female earnings in the United States with a correlation coefficient (R) of -0.273 and weighted average of $39,159. Similarly, the statistical analysis conducted on geographies consisting of 158,712,262 people shows a weak negative correlation between the proportion of Immigrants from Bolivia and median female earnings in the United States with a correlation coefficient (R) of -0.292 and weighted average of $43,467, a difference of 11.0%.
Median Female Earnings Correlation Summary
| Measurement | Assyrian/Chaldean/Syriac | Immigrants from Bolivia |
| Minimum | $26,764 | $8,362 |
| Maximum | $55,774 | $80,500 |
| Range | $29,010 | $72,138 |
| Mean | $40,436 | $44,359 |
| Median | $40,603 | $43,989 |
| Interquartile 25% (IQ1) | $35,184 | $37,479 |
| Interquartile 75% (IQ3) | $44,710 | $50,958 |
| Interquartile Range (IQR) | $9,527 | $13,479 |
| Standard Deviation (Sample) | $6,169 | $12,073 |
| Standard Deviation (Population) | $6,129 | $12,007 |
Similar Demographics by Median Female Earnings
Demographics Similar to Assyrians/Chaldeans/Syriacs by Median Female Earnings
In terms of median female earnings, the demographic groups most similar to Assyrians/Chaldeans/Syriacs are Immigrants from Costa Rica ($39,186, a difference of 0.070%), Ecuadorian ($39,117, a difference of 0.11%), Icelander ($39,109, a difference of 0.13%), Uruguayan ($39,228, a difference of 0.17%), and Immigrants from Panama ($39,049, a difference of 0.28%).
| Demographics | Rating | Rank | Median Female Earnings |
| Puget Sound Salish | 33.9 /100 | #190 | Fair $39,376 |
| Immigrants | Western Africa | 32.7 /100 | #191 | Fair $39,351 |
| Immigrants | Immigrants | 31.7 /100 | #192 | Fair $39,328 |
| Immigrants | Nigeria | 30.2 /100 | #193 | Fair $39,294 |
| Irish | 30.0 /100 | #194 | Fair $39,291 |
| Uruguayans | 27.3 /100 | #195 | Fair $39,228 |
| Immigrants | Costa Rica | 25.6 /100 | #196 | Fair $39,186 |
| Assyrians/Chaldeans/Syriacs | 24.6 /100 | #197 | Fair $39,159 |
| Ecuadorians | 23.0 /100 | #198 | Fair $39,117 |
| Icelanders | 22.7 /100 | #199 | Fair $39,109 |
| Immigrants | Panama | 20.6 /100 | #200 | Fair $39,049 |
| Panamanians | 20.6 /100 | #201 | Fair $39,049 |
| Slovaks | 19.9 /100 | #202 | Poor $39,029 |
| Czechs | 18.7 /100 | #203 | Poor $38,992 |
| Immigrants | Uruguay | 17.3 /100 | #204 | Poor $38,945 |
Demographics Similar to Immigrants from Bolivia by Median Female Earnings
In terms of median female earnings, the demographic groups most similar to Immigrants from Bolivia are Bolivian ($43,445, a difference of 0.050%), Immigrants from Europe ($43,523, a difference of 0.13%), Immigrants from Indonesia ($43,412, a difference of 0.13%), Immigrants from Serbia ($43,385, a difference of 0.19%), and Immigrants from Czechoslovakia ($43,571, a difference of 0.24%).
| Demographics | Rating | Rank | Median Female Earnings |
| Israelis | 100.0 /100 | #39 | Exceptional $43,852 |
| Immigrants | Malaysia | 100.0 /100 | #40 | Exceptional $43,835 |
| Bhutanese | 100.0 /100 | #41 | Exceptional $43,648 |
| Immigrants | Denmark | 100.0 /100 | #42 | Exceptional $43,646 |
| Bulgarians | 100.0 /100 | #43 | Exceptional $43,638 |
| Immigrants | Czechoslovakia | 100.0 /100 | #44 | Exceptional $43,571 |
| Immigrants | Europe | 100.0 /100 | #45 | Exceptional $43,523 |
| Immigrants | Bolivia | 100.0 /100 | #46 | Exceptional $43,467 |
| Bolivians | 100.0 /100 | #47 | Exceptional $43,445 |
| Immigrants | Indonesia | 100.0 /100 | #48 | Exceptional $43,412 |
| Immigrants | Serbia | 100.0 /100 | #49 | Exceptional $43,385 |
| Immigrants | Uzbekistan | 100.0 /100 | #50 | Exceptional $43,363 |
| Maltese | 100.0 /100 | #51 | Exceptional $43,357 |
| Immigrants | Lithuania | 99.9 /100 | #52 | Exceptional $43,317 |
| Immigrants | Eastern Europe | 99.9 /100 | #53 | Exceptional $43,309 |