Assyrian/Chaldean/Syriac vs Immigrants from Bosnia and Herzegovina Median Female Earnings
COMPARE
Assyrian/Chaldean/Syriac
Immigrants from Bosnia and Herzegovina
Median Female Earnings
Median Female Earnings Comparison
Assyrians/Chaldeans/Syriacs
Immigrants from Bosnia and Herzegovina
$39,159
MEDIAN FEMALE EARNINGS
24.6/ 100
METRIC RATING
197th/ 347
METRIC RANK
$38,886
MEDIAN FEMALE EARNINGS
15.6/ 100
METRIC RATING
206th/ 347
METRIC RANK
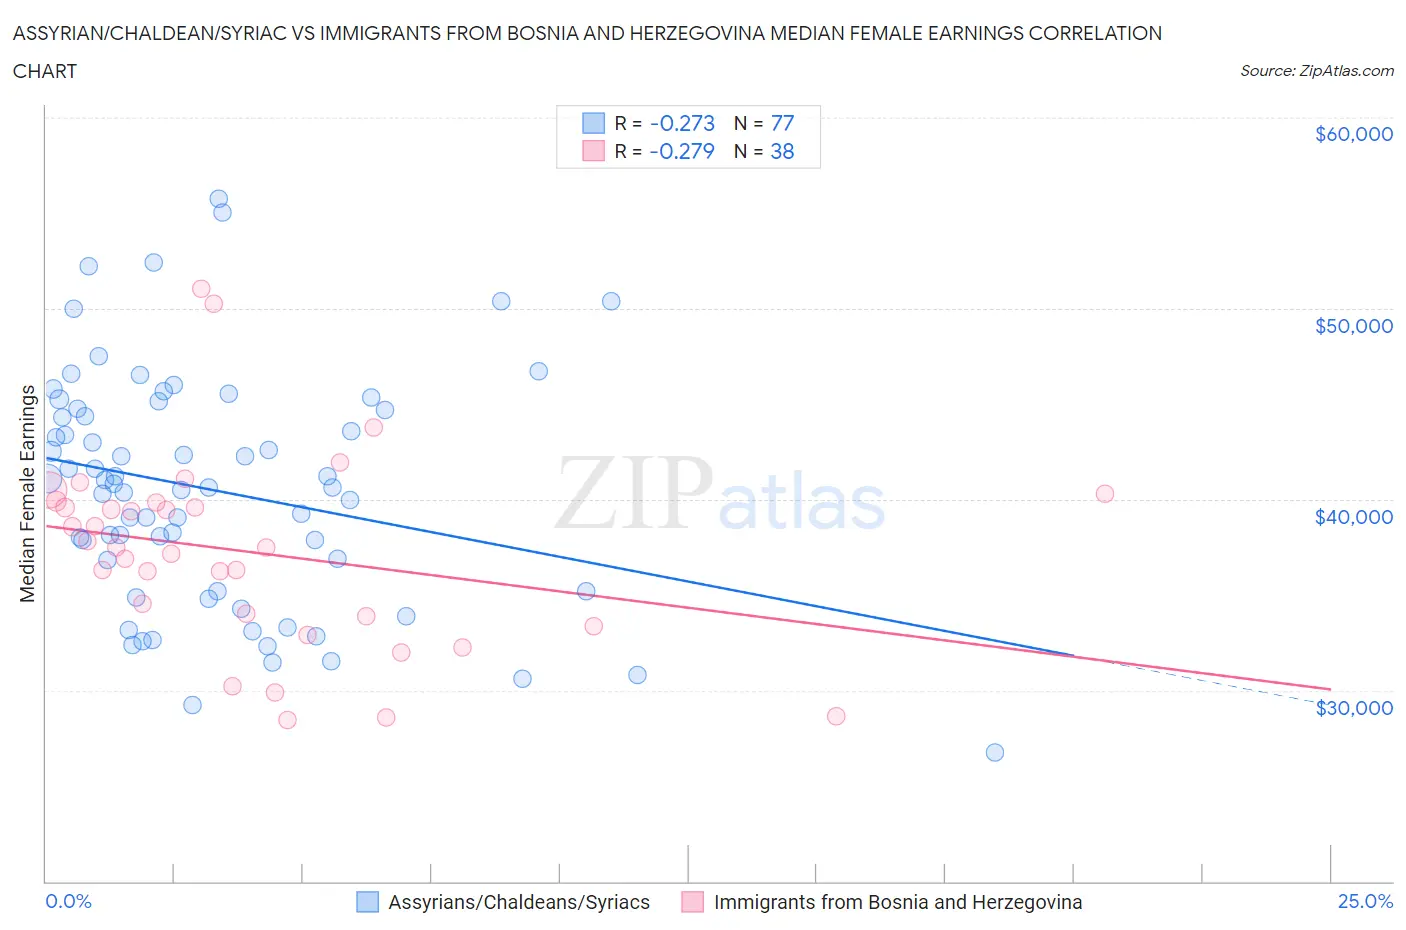
Assyrian/Chaldean/Syriac vs Immigrants from Bosnia and Herzegovina Median Female Earnings Correlation Chart
The statistical analysis conducted on geographies consisting of 110,265,934 people shows a weak negative correlation between the proportion of Assyrians/Chaldeans/Syriacs and median female earnings in the United States with a correlation coefficient (R) of -0.273 and weighted average of $39,159. Similarly, the statistical analysis conducted on geographies consisting of 156,788,843 people shows a weak negative correlation between the proportion of Immigrants from Bosnia and Herzegovina and median female earnings in the United States with a correlation coefficient (R) of -0.279 and weighted average of $38,886, a difference of 0.70%.
Median Female Earnings Correlation Summary
| Measurement | Assyrian/Chaldean/Syriac | Immigrants from Bosnia and Herzegovina |
| Minimum | $26,764 | $28,455 |
| Maximum | $55,774 | $50,999 |
| Range | $29,010 | $22,544 |
| Mean | $40,436 | $37,228 |
| Median | $40,603 | $37,485 |
| Interquartile 25% (IQ1) | $35,184 | $33,898 |
| Interquartile 75% (IQ3) | $44,710 | $39,866 |
| Interquartile Range (IQR) | $9,527 | $5,968 |
| Standard Deviation (Sample) | $6,169 | $5,099 |
| Standard Deviation (Population) | $6,129 | $5,032 |
Demographics Similar to Assyrians/Chaldeans/Syriacs and Immigrants from Bosnia and Herzegovina by Median Female Earnings
In terms of median female earnings, the demographic groups most similar to Assyrians/Chaldeans/Syriacs are Immigrants from Costa Rica ($39,186, a difference of 0.070%), Ecuadorian ($39,117, a difference of 0.11%), Icelander ($39,109, a difference of 0.13%), Uruguayan ($39,228, a difference of 0.17%), and Immigrants from Panama ($39,049, a difference of 0.28%). Similarly, the demographic groups most similar to Immigrants from Bosnia and Herzegovina are Immigrants from Colombia ($38,913, a difference of 0.070%), Immigrants from Cambodia ($38,833, a difference of 0.14%), Immigrants from Uruguay ($38,945, a difference of 0.15%), Immigrants from Thailand ($38,810, a difference of 0.20%), and Norwegian ($38,802, a difference of 0.22%).
| Demographics | Rating | Rank | Median Female Earnings |
| Immigrants | Western Africa | 32.7 /100 | #191 | Fair $39,351 |
| Immigrants | Immigrants | 31.7 /100 | #192 | Fair $39,328 |
| Immigrants | Nigeria | 30.2 /100 | #193 | Fair $39,294 |
| Irish | 30.0 /100 | #194 | Fair $39,291 |
| Uruguayans | 27.3 /100 | #195 | Fair $39,228 |
| Immigrants | Costa Rica | 25.6 /100 | #196 | Fair $39,186 |
| Assyrians/Chaldeans/Syriacs | 24.6 /100 | #197 | Fair $39,159 |
| Ecuadorians | 23.0 /100 | #198 | Fair $39,117 |
| Icelanders | 22.7 /100 | #199 | Fair $39,109 |
| Immigrants | Panama | 20.6 /100 | #200 | Fair $39,049 |
| Panamanians | 20.6 /100 | #201 | Fair $39,049 |
| Slovaks | 19.9 /100 | #202 | Poor $39,029 |
| Czechs | 18.7 /100 | #203 | Poor $38,992 |
| Immigrants | Uruguay | 17.3 /100 | #204 | Poor $38,945 |
| Immigrants | Colombia | 16.3 /100 | #205 | Poor $38,913 |
| Immigrants | Bosnia and Herzegovina | 15.6 /100 | #206 | Poor $38,886 |
| Immigrants | Cambodia | 14.2 /100 | #207 | Poor $38,833 |
| Immigrants | Thailand | 13.6 /100 | #208 | Poor $38,810 |
| Norwegians | 13.4 /100 | #209 | Poor $38,802 |
| Czechoslovakians | 12.0 /100 | #210 | Poor $38,738 |
| Aleuts | 11.6 /100 | #211 | Poor $38,719 |