Assyrian/Chaldean/Syriac vs Creek Median Female Earnings
COMPARE
Assyrian/Chaldean/Syriac
Creek
Median Female Earnings
Median Female Earnings Comparison
Assyrians/Chaldeans/Syriacs
Creek
$39,159
MEDIAN FEMALE EARNINGS
24.6/ 100
METRIC RATING
197th/ 347
METRIC RANK
$33,437
MEDIAN FEMALE EARNINGS
0.0/ 100
METRIC RATING
335th/ 347
METRIC RANK
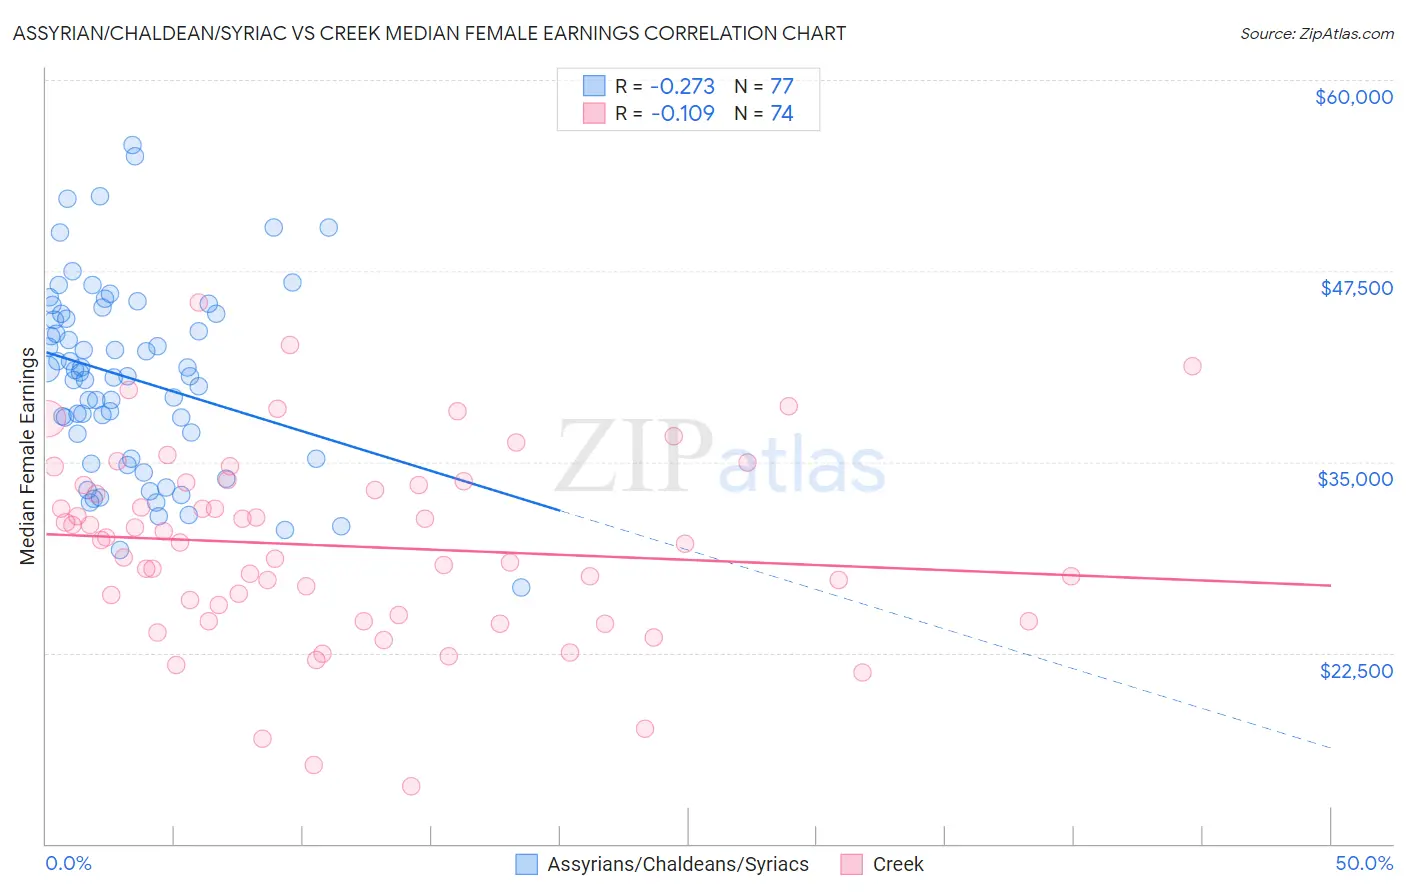
Assyrian/Chaldean/Syriac vs Creek Median Female Earnings Correlation Chart
The statistical analysis conducted on geographies consisting of 110,265,934 people shows a weak negative correlation between the proportion of Assyrians/Chaldeans/Syriacs and median female earnings in the United States with a correlation coefficient (R) of -0.273 and weighted average of $39,159. Similarly, the statistical analysis conducted on geographies consisting of 178,409,483 people shows a poor negative correlation between the proportion of Creek and median female earnings in the United States with a correlation coefficient (R) of -0.109 and weighted average of $33,437, a difference of 17.1%.
Median Female Earnings Correlation Summary
| Measurement | Assyrian/Chaldean/Syriac | Creek |
| Minimum | $26,764 | $13,750 |
| Maximum | $55,774 | $45,402 |
| Range | $29,010 | $31,652 |
| Mean | $40,436 | $29,490 |
| Median | $40,603 | $29,783 |
| Interquartile 25% (IQ1) | $35,184 | $24,936 |
| Interquartile 75% (IQ3) | $44,710 | $33,500 |
| Interquartile Range (IQR) | $9,527 | $8,564 |
| Standard Deviation (Sample) | $6,169 | $6,205 |
| Standard Deviation (Population) | $6,129 | $6,162 |
Similar Demographics by Median Female Earnings
Demographics Similar to Assyrians/Chaldeans/Syriacs by Median Female Earnings
In terms of median female earnings, the demographic groups most similar to Assyrians/Chaldeans/Syriacs are Immigrants from Costa Rica ($39,186, a difference of 0.070%), Ecuadorian ($39,117, a difference of 0.11%), Icelander ($39,109, a difference of 0.13%), Uruguayan ($39,228, a difference of 0.17%), and Immigrants from Panama ($39,049, a difference of 0.28%).
| Demographics | Rating | Rank | Median Female Earnings |
| Puget Sound Salish | 33.9 /100 | #190 | Fair $39,376 |
| Immigrants | Western Africa | 32.7 /100 | #191 | Fair $39,351 |
| Immigrants | Immigrants | 31.7 /100 | #192 | Fair $39,328 |
| Immigrants | Nigeria | 30.2 /100 | #193 | Fair $39,294 |
| Irish | 30.0 /100 | #194 | Fair $39,291 |
| Uruguayans | 27.3 /100 | #195 | Fair $39,228 |
| Immigrants | Costa Rica | 25.6 /100 | #196 | Fair $39,186 |
| Assyrians/Chaldeans/Syriacs | 24.6 /100 | #197 | Fair $39,159 |
| Ecuadorians | 23.0 /100 | #198 | Fair $39,117 |
| Icelanders | 22.7 /100 | #199 | Fair $39,109 |
| Immigrants | Panama | 20.6 /100 | #200 | Fair $39,049 |
| Panamanians | 20.6 /100 | #201 | Fair $39,049 |
| Slovaks | 19.9 /100 | #202 | Poor $39,029 |
| Czechs | 18.7 /100 | #203 | Poor $38,992 |
| Immigrants | Uruguay | 17.3 /100 | #204 | Poor $38,945 |
Demographics Similar to Creek by Median Female Earnings
In terms of median female earnings, the demographic groups most similar to Creek are Ottawa ($33,378, a difference of 0.18%), Yakama ($33,354, a difference of 0.25%), Immigrants from Cuba ($33,291, a difference of 0.44%), Spanish American Indian ($33,625, a difference of 0.56%), and Immigrants from Mexico ($33,236, a difference of 0.61%).
| Demographics | Rating | Rank | Median Female Earnings |
| Immigrants | Central America | 0.0 /100 | #328 | Tragic $33,953 |
| Hopi | 0.0 /100 | #329 | Tragic $33,932 |
| Menominee | 0.0 /100 | #330 | Tragic $33,894 |
| Natives/Alaskans | 0.0 /100 | #331 | Tragic $33,806 |
| Choctaw | 0.0 /100 | #332 | Tragic $33,775 |
| Mexicans | 0.0 /100 | #333 | Tragic $33,664 |
| Spanish American Indians | 0.0 /100 | #334 | Tragic $33,625 |
| Creek | 0.0 /100 | #335 | Tragic $33,437 |
| Ottawa | 0.0 /100 | #336 | Tragic $33,378 |
| Yakama | 0.0 /100 | #337 | Tragic $33,354 |
| Immigrants | Cuba | 0.0 /100 | #338 | Tragic $33,291 |
| Immigrants | Mexico | 0.0 /100 | #339 | Tragic $33,236 |
| Tohono O'odham | 0.0 /100 | #340 | Tragic $33,205 |
| Navajo | 0.0 /100 | #341 | Tragic $33,046 |
| Yup'ik | 0.0 /100 | #342 | Tragic $32,730 |