Assyrian/Chaldean/Syriac vs Immigrants from Asia Median Female Earnings
COMPARE
Assyrian/Chaldean/Syriac
Immigrants from Asia
Median Female Earnings
Median Female Earnings Comparison
Assyrians/Chaldeans/Syriacs
Immigrants from Asia
$39,159
MEDIAN FEMALE EARNINGS
24.6/ 100
METRIC RATING
197th/ 347
METRIC RANK
$44,198
MEDIAN FEMALE EARNINGS
100.0/ 100
METRIC RATING
33rd/ 347
METRIC RANK
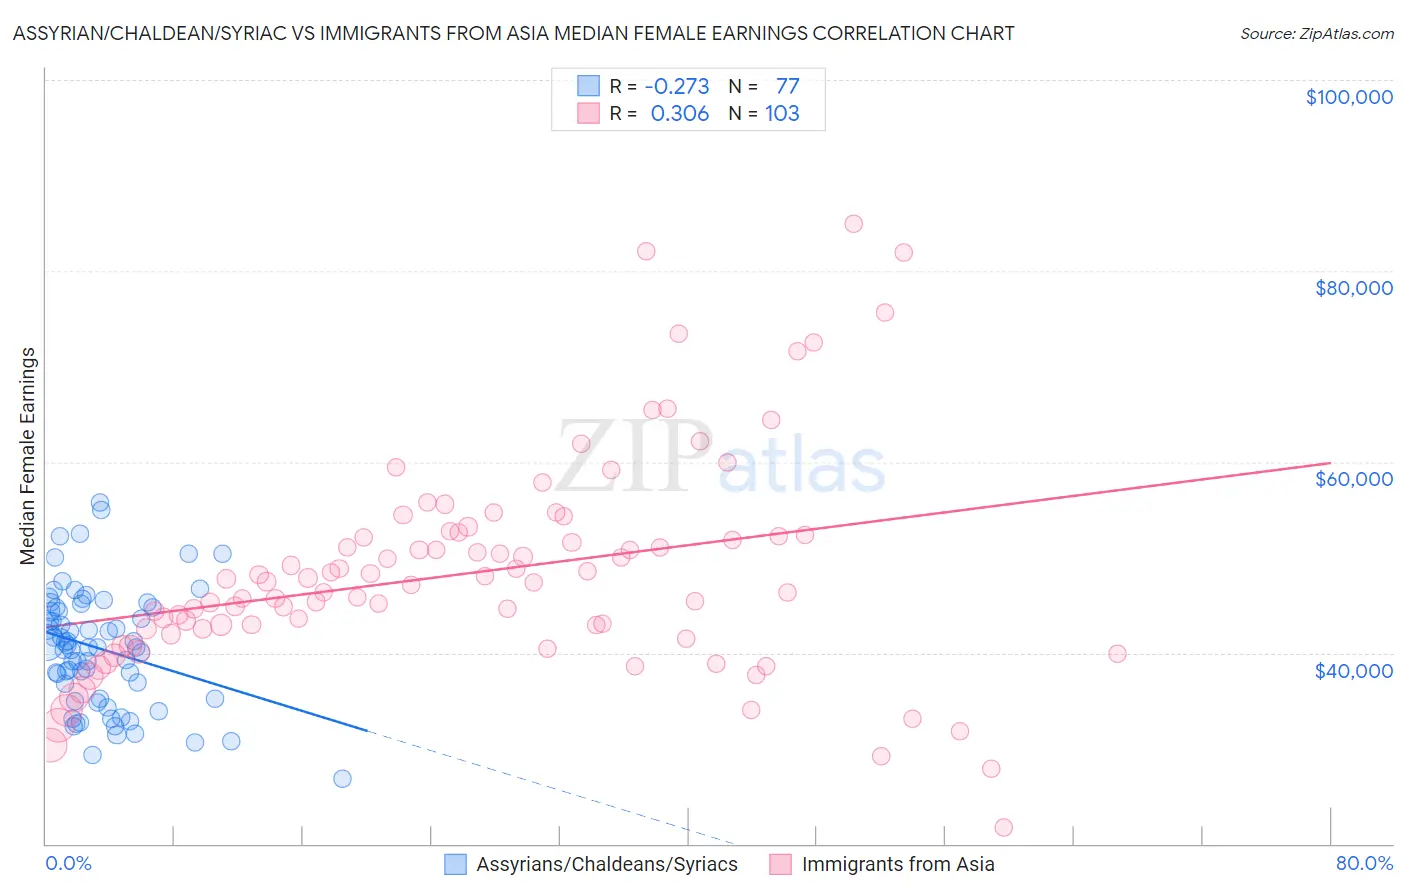
Assyrian/Chaldean/Syriac vs Immigrants from Asia Median Female Earnings Correlation Chart
The statistical analysis conducted on geographies consisting of 110,265,934 people shows a weak negative correlation between the proportion of Assyrians/Chaldeans/Syriacs and median female earnings in the United States with a correlation coefficient (R) of -0.273 and weighted average of $39,159. Similarly, the statistical analysis conducted on geographies consisting of 548,277,382 people shows a mild positive correlation between the proportion of Immigrants from Asia and median female earnings in the United States with a correlation coefficient (R) of 0.306 and weighted average of $44,198, a difference of 12.9%.
Median Female Earnings Correlation Summary
| Measurement | Assyrian/Chaldean/Syriac | Immigrants from Asia |
| Minimum | $26,764 | $21,667 |
| Maximum | $55,774 | $84,949 |
| Range | $29,010 | $63,282 |
| Mean | $40,436 | $48,373 |
| Median | $40,603 | $47,404 |
| Interquartile 25% (IQ1) | $35,184 | $41,959 |
| Interquartile 75% (IQ3) | $44,710 | $52,302 |
| Interquartile Range (IQR) | $9,527 | $10,343 |
| Standard Deviation (Sample) | $6,169 | $11,346 |
| Standard Deviation (Population) | $6,129 | $11,291 |
Similar Demographics by Median Female Earnings
Demographics Similar to Assyrians/Chaldeans/Syriacs by Median Female Earnings
In terms of median female earnings, the demographic groups most similar to Assyrians/Chaldeans/Syriacs are Immigrants from Costa Rica ($39,186, a difference of 0.070%), Ecuadorian ($39,117, a difference of 0.11%), Icelander ($39,109, a difference of 0.13%), Uruguayan ($39,228, a difference of 0.17%), and Immigrants from Panama ($39,049, a difference of 0.28%).
| Demographics | Rating | Rank | Median Female Earnings |
| Puget Sound Salish | 33.9 /100 | #190 | Fair $39,376 |
| Immigrants | Western Africa | 32.7 /100 | #191 | Fair $39,351 |
| Immigrants | Immigrants | 31.7 /100 | #192 | Fair $39,328 |
| Immigrants | Nigeria | 30.2 /100 | #193 | Fair $39,294 |
| Irish | 30.0 /100 | #194 | Fair $39,291 |
| Uruguayans | 27.3 /100 | #195 | Fair $39,228 |
| Immigrants | Costa Rica | 25.6 /100 | #196 | Fair $39,186 |
| Assyrians/Chaldeans/Syriacs | 24.6 /100 | #197 | Fair $39,159 |
| Ecuadorians | 23.0 /100 | #198 | Fair $39,117 |
| Icelanders | 22.7 /100 | #199 | Fair $39,109 |
| Immigrants | Panama | 20.6 /100 | #200 | Fair $39,049 |
| Panamanians | 20.6 /100 | #201 | Fair $39,049 |
| Slovaks | 19.9 /100 | #202 | Poor $39,029 |
| Czechs | 18.7 /100 | #203 | Poor $38,992 |
| Immigrants | Uruguay | 17.3 /100 | #204 | Poor $38,945 |
Demographics Similar to Immigrants from Asia by Median Female Earnings
In terms of median female earnings, the demographic groups most similar to Immigrants from Asia are Russian ($44,169, a difference of 0.070%), Immigrants from Sri Lanka ($44,161, a difference of 0.080%), Immigrants from Turkey ($44,066, a difference of 0.30%), Immigrants from Northern Europe ($44,366, a difference of 0.38%), and Immigrants from Switzerland ($43,996, a difference of 0.46%).
| Demographics | Rating | Rank | Median Female Earnings |
| Immigrants | Belarus | 100.0 /100 | #26 | Exceptional $44,757 |
| Turks | 100.0 /100 | #27 | Exceptional $44,695 |
| Immigrants | Russia | 100.0 /100 | #28 | Exceptional $44,680 |
| Immigrants | Belgium | 100.0 /100 | #29 | Exceptional $44,587 |
| Asians | 100.0 /100 | #30 | Exceptional $44,586 |
| Immigrants | France | 100.0 /100 | #31 | Exceptional $44,541 |
| Immigrants | Northern Europe | 100.0 /100 | #32 | Exceptional $44,366 |
| Immigrants | Asia | 100.0 /100 | #33 | Exceptional $44,198 |
| Russians | 100.0 /100 | #34 | Exceptional $44,169 |
| Immigrants | Sri Lanka | 100.0 /100 | #35 | Exceptional $44,161 |
| Immigrants | Turkey | 100.0 /100 | #36 | Exceptional $44,066 |
| Immigrants | Switzerland | 100.0 /100 | #37 | Exceptional $43,996 |
| Latvians | 100.0 /100 | #38 | Exceptional $43,941 |
| Israelis | 100.0 /100 | #39 | Exceptional $43,852 |
| Immigrants | Malaysia | 100.0 /100 | #40 | Exceptional $43,835 |