Assyrian/Chaldean/Syriac vs Immigrants from Africa Median Female Earnings
COMPARE
Assyrian/Chaldean/Syriac
Immigrants from Africa
Median Female Earnings
Median Female Earnings Comparison
Assyrians/Chaldeans/Syriacs
Immigrants from Africa
$39,159
MEDIAN FEMALE EARNINGS
24.6/ 100
METRIC RATING
197th/ 347
METRIC RANK
$40,257
MEDIAN FEMALE EARNINGS
76.2/ 100
METRIC RATING
155th/ 347
METRIC RANK
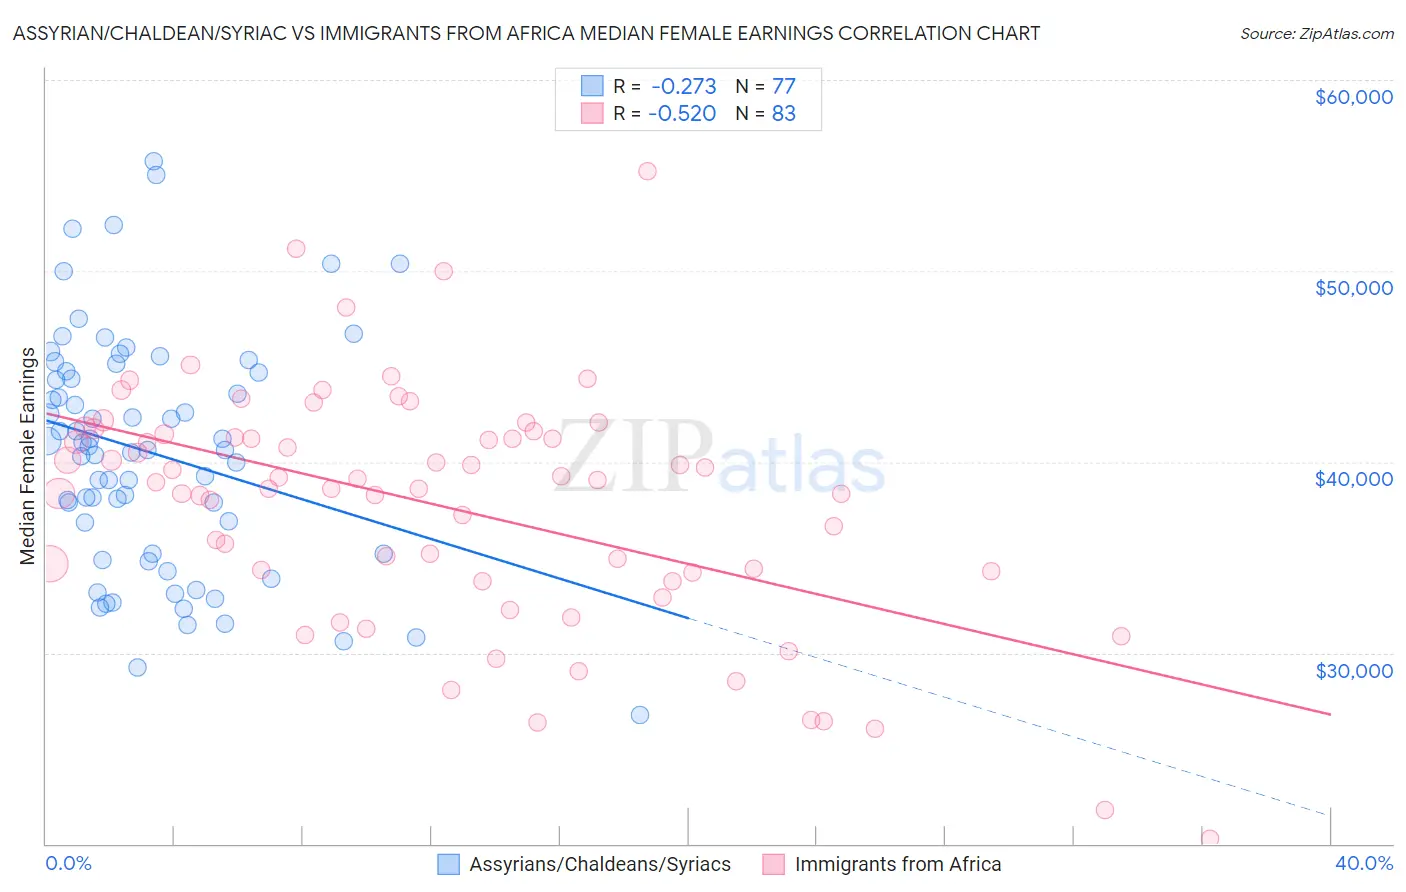
Assyrian/Chaldean/Syriac vs Immigrants from Africa Median Female Earnings Correlation Chart
The statistical analysis conducted on geographies consisting of 110,265,934 people shows a weak negative correlation between the proportion of Assyrians/Chaldeans/Syriacs and median female earnings in the United States with a correlation coefficient (R) of -0.273 and weighted average of $39,159. Similarly, the statistical analysis conducted on geographies consisting of 469,175,130 people shows a substantial negative correlation between the proportion of Immigrants from Africa and median female earnings in the United States with a correlation coefficient (R) of -0.520 and weighted average of $40,257, a difference of 2.8%.
Median Female Earnings Correlation Summary
| Measurement | Assyrian/Chaldean/Syriac | Immigrants from Africa |
| Minimum | $26,764 | $20,281 |
| Maximum | $55,774 | $55,224 |
| Range | $29,010 | $34,943 |
| Mean | $40,436 | $37,710 |
| Median | $40,603 | $38,916 |
| Interquartile 25% (IQ1) | $35,184 | $34,205 |
| Interquartile 75% (IQ3) | $44,710 | $41,443 |
| Interquartile Range (IQR) | $9,527 | $7,238 |
| Standard Deviation (Sample) | $6,169 | $6,266 |
| Standard Deviation (Population) | $6,129 | $6,228 |
Similar Demographics by Median Female Earnings
Demographics Similar to Assyrians/Chaldeans/Syriacs by Median Female Earnings
In terms of median female earnings, the demographic groups most similar to Assyrians/Chaldeans/Syriacs are Immigrants from Costa Rica ($39,186, a difference of 0.070%), Ecuadorian ($39,117, a difference of 0.11%), Icelander ($39,109, a difference of 0.13%), Uruguayan ($39,228, a difference of 0.17%), and Immigrants from Panama ($39,049, a difference of 0.28%).
| Demographics | Rating | Rank | Median Female Earnings |
| Puget Sound Salish | 33.9 /100 | #190 | Fair $39,376 |
| Immigrants | Western Africa | 32.7 /100 | #191 | Fair $39,351 |
| Immigrants | Immigrants | 31.7 /100 | #192 | Fair $39,328 |
| Immigrants | Nigeria | 30.2 /100 | #193 | Fair $39,294 |
| Irish | 30.0 /100 | #194 | Fair $39,291 |
| Uruguayans | 27.3 /100 | #195 | Fair $39,228 |
| Immigrants | Costa Rica | 25.6 /100 | #196 | Fair $39,186 |
| Assyrians/Chaldeans/Syriacs | 24.6 /100 | #197 | Fair $39,159 |
| Ecuadorians | 23.0 /100 | #198 | Fair $39,117 |
| Icelanders | 22.7 /100 | #199 | Fair $39,109 |
| Immigrants | Panama | 20.6 /100 | #200 | Fair $39,049 |
| Panamanians | 20.6 /100 | #201 | Fair $39,049 |
| Slovaks | 19.9 /100 | #202 | Poor $39,029 |
| Czechs | 18.7 /100 | #203 | Poor $38,992 |
| Immigrants | Uruguay | 17.3 /100 | #204 | Poor $38,945 |
Demographics Similar to Immigrants from Africa by Median Female Earnings
In terms of median female earnings, the demographic groups most similar to Immigrants from Africa are Peruvian ($40,234, a difference of 0.060%), British West Indian ($40,299, a difference of 0.10%), Immigrants from Oceania ($40,297, a difference of 0.10%), West Indian ($40,317, a difference of 0.15%), and Portuguese ($40,177, a difference of 0.20%).
| Demographics | Rating | Rank | Median Female Earnings |
| Poles | 80.2 /100 | #148 | Excellent $40,371 |
| Immigrants | Cameroon | 79.7 /100 | #149 | Good $40,354 |
| Immigrants | Chile | 79.6 /100 | #150 | Good $40,353 |
| Immigrants | Armenia | 79.2 /100 | #151 | Good $40,340 |
| West Indians | 78.4 /100 | #152 | Good $40,317 |
| British West Indians | 77.7 /100 | #153 | Good $40,299 |
| Immigrants | Oceania | 77.6 /100 | #154 | Good $40,297 |
| Immigrants | Africa | 76.2 /100 | #155 | Good $40,257 |
| Peruvians | 75.3 /100 | #156 | Good $40,234 |
| Portuguese | 73.0 /100 | #157 | Good $40,177 |
| Immigrants | Senegal | 72.2 /100 | #158 | Good $40,157 |
| Immigrants | Vietnam | 72.0 /100 | #159 | Good $40,153 |
| Inupiat | 68.9 /100 | #160 | Good $40,080 |
| Alsatians | 68.0 /100 | #161 | Good $40,060 |
| South American Indians | 66.1 /100 | #162 | Good $40,019 |