Immigrants from South Eastern Asia vs Creek Median Female Earnings
COMPARE
Immigrants from South Eastern Asia
Creek
Median Female Earnings
Median Female Earnings Comparison
Immigrants from South Eastern Asia
Creek
$40,558
MEDIAN FEMALE EARNINGS
85.7/ 100
METRIC RATING
139th/ 347
METRIC RANK
$33,437
MEDIAN FEMALE EARNINGS
0.0/ 100
METRIC RATING
335th/ 347
METRIC RANK
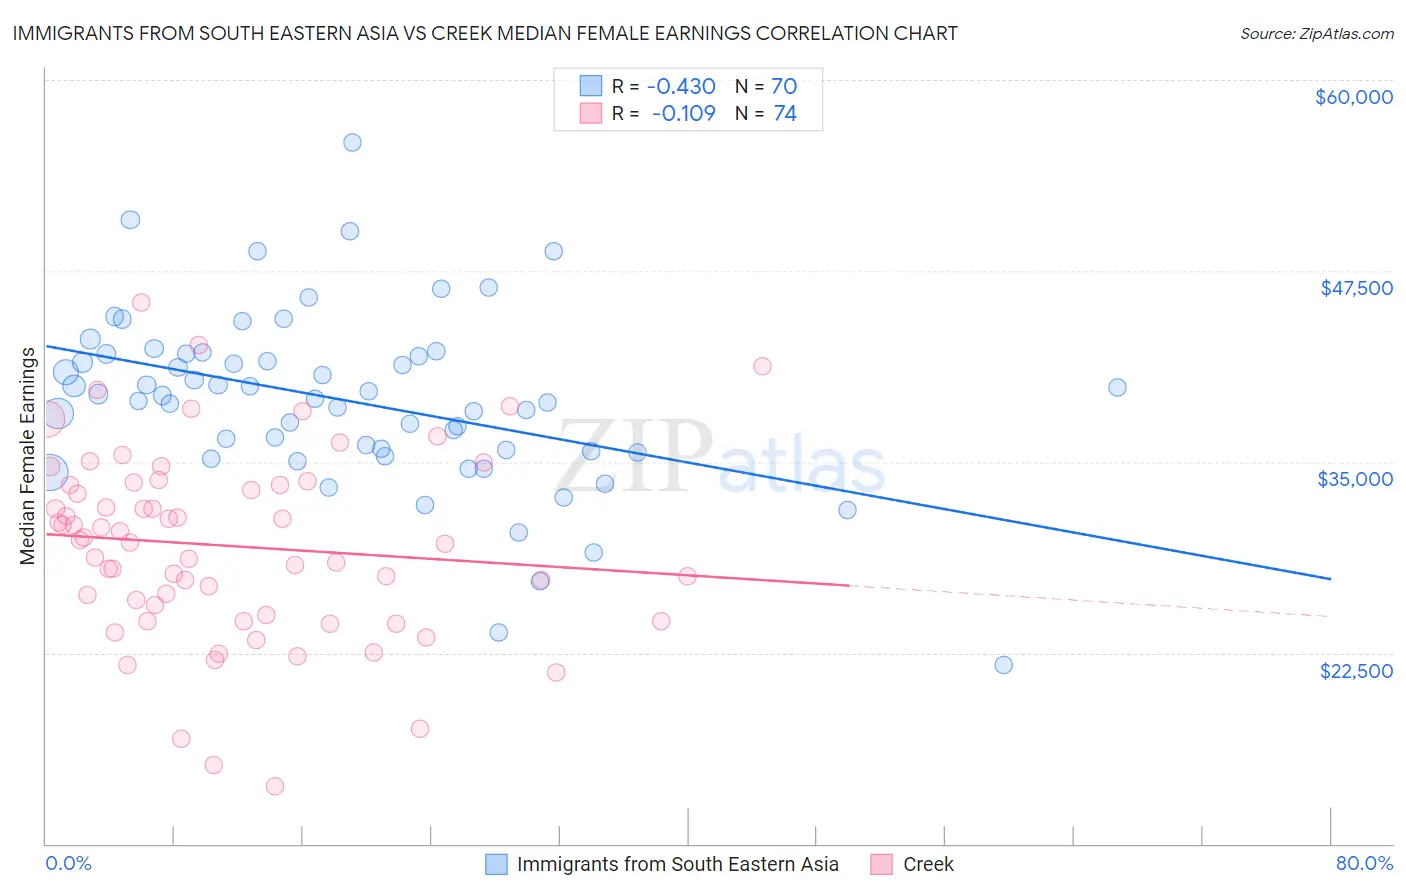
Immigrants from South Eastern Asia vs Creek Median Female Earnings Correlation Chart
The statistical analysis conducted on geographies consisting of 512,224,211 people shows a moderate negative correlation between the proportion of Immigrants from South Eastern Asia and median female earnings in the United States with a correlation coefficient (R) of -0.430 and weighted average of $40,558. Similarly, the statistical analysis conducted on geographies consisting of 178,409,483 people shows a poor negative correlation between the proportion of Creek and median female earnings in the United States with a correlation coefficient (R) of -0.109 and weighted average of $33,437, a difference of 21.3%.
Median Female Earnings Correlation Summary
| Measurement | Immigrants from South Eastern Asia | Creek |
| Minimum | $21,667 | $13,750 |
| Maximum | $55,907 | $45,402 |
| Range | $34,240 | $31,652 |
| Mean | $38,991 | $29,490 |
| Median | $39,248 | $29,783 |
| Interquartile 25% (IQ1) | $35,697 | $24,936 |
| Interquartile 75% (IQ3) | $42,089 | $33,500 |
| Interquartile Range (IQR) | $6,392 | $8,564 |
| Standard Deviation (Sample) | $5,838 | $6,205 |
| Standard Deviation (Population) | $5,797 | $6,162 |
Similar Demographics by Median Female Earnings
Demographics Similar to Immigrants from South Eastern Asia by Median Female Earnings
In terms of median female earnings, the demographic groups most similar to Immigrants from South Eastern Asia are Taiwanese ($40,576, a difference of 0.040%), Serbian ($40,539, a difference of 0.050%), Pakistani ($40,596, a difference of 0.090%), Immigrants from Syria ($40,499, a difference of 0.15%), and Sri Lankan ($40,496, a difference of 0.15%).
| Demographics | Rating | Rank | Median Female Earnings |
| Immigrants | Uganda | 89.7 /100 | #132 | Excellent $40,739 |
| Syrians | 89.5 /100 | #133 | Excellent $40,727 |
| Arabs | 89.3 /100 | #134 | Excellent $40,718 |
| Immigrants | Nepal | 89.0 /100 | #135 | Excellent $40,704 |
| Immigrants | Eastern Africa | 87.7 /100 | #136 | Excellent $40,644 |
| Pakistanis | 86.6 /100 | #137 | Excellent $40,596 |
| Taiwanese | 86.1 /100 | #138 | Excellent $40,576 |
| Immigrants | South Eastern Asia | 85.7 /100 | #139 | Excellent $40,558 |
| Serbians | 85.2 /100 | #140 | Excellent $40,539 |
| Immigrants | Syria | 84.1 /100 | #141 | Excellent $40,499 |
| Sri Lankans | 84.0 /100 | #142 | Excellent $40,496 |
| Northern Europeans | 83.9 /100 | #143 | Excellent $40,491 |
| Immigrants | North Macedonia | 83.8 /100 | #144 | Excellent $40,488 |
| Brazilians | 83.6 /100 | #145 | Excellent $40,483 |
| Ghanaians | 82.1 /100 | #146 | Excellent $40,429 |
Demographics Similar to Creek by Median Female Earnings
In terms of median female earnings, the demographic groups most similar to Creek are Ottawa ($33,378, a difference of 0.18%), Yakama ($33,354, a difference of 0.25%), Immigrants from Cuba ($33,291, a difference of 0.44%), Spanish American Indian ($33,625, a difference of 0.56%), and Immigrants from Mexico ($33,236, a difference of 0.61%).
| Demographics | Rating | Rank | Median Female Earnings |
| Immigrants | Central America | 0.0 /100 | #328 | Tragic $33,953 |
| Hopi | 0.0 /100 | #329 | Tragic $33,932 |
| Menominee | 0.0 /100 | #330 | Tragic $33,894 |
| Natives/Alaskans | 0.0 /100 | #331 | Tragic $33,806 |
| Choctaw | 0.0 /100 | #332 | Tragic $33,775 |
| Mexicans | 0.0 /100 | #333 | Tragic $33,664 |
| Spanish American Indians | 0.0 /100 | #334 | Tragic $33,625 |
| Creek | 0.0 /100 | #335 | Tragic $33,437 |
| Ottawa | 0.0 /100 | #336 | Tragic $33,378 |
| Yakama | 0.0 /100 | #337 | Tragic $33,354 |
| Immigrants | Cuba | 0.0 /100 | #338 | Tragic $33,291 |
| Immigrants | Mexico | 0.0 /100 | #339 | Tragic $33,236 |
| Tohono O'odham | 0.0 /100 | #340 | Tragic $33,205 |
| Navajo | 0.0 /100 | #341 | Tragic $33,046 |
| Yup'ik | 0.0 /100 | #342 | Tragic $32,730 |