Assyrian/Chaldean/Syriac vs Creek 8th Grade
COMPARE
Assyrian/Chaldean/Syriac
Creek
8th Grade
8th Grade Comparison
Assyrians/Chaldeans/Syriacs
Creek
95.6%
8TH GRADE
24.5/ 100
METRIC RATING
196th/ 347
METRIC RANK
96.6%
8TH GRADE
99.7/ 100
METRIC RATING
68th/ 347
METRIC RANK
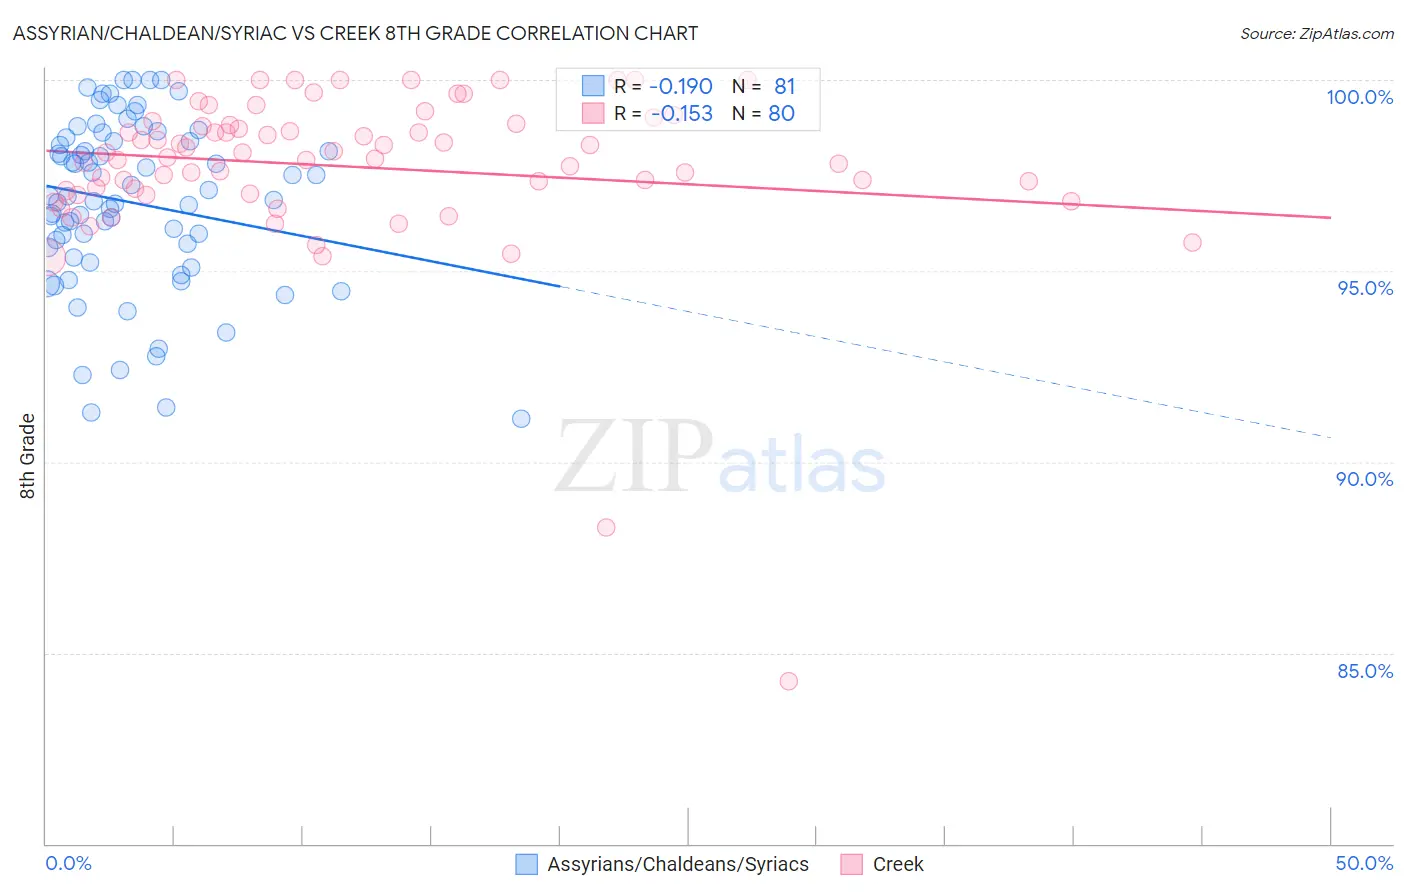
Assyrian/Chaldean/Syriac vs Creek 8th Grade Correlation Chart
The statistical analysis conducted on geographies consisting of 110,318,304 people shows a poor negative correlation between the proportion of Assyrians/Chaldeans/Syriacs and percentage of population with at least 8th grade education in the United States with a correlation coefficient (R) of -0.190 and weighted average of 95.6%. Similarly, the statistical analysis conducted on geographies consisting of 178,480,629 people shows a poor negative correlation between the proportion of Creek and percentage of population with at least 8th grade education in the United States with a correlation coefficient (R) of -0.153 and weighted average of 96.6%, a difference of 1.1%.
8th Grade Correlation Summary
| Measurement | Assyrian/Chaldean/Syriac | Creek |
| Minimum | 91.1% | 84.3% |
| Maximum | 100.0% | 100.0% |
| Range | 8.9% | 15.7% |
| Mean | 96.8% | 97.7% |
| Median | 96.9% | 98.0% |
| Interquartile 25% (IQ1) | 95.5% | 97.1% |
| Interquartile 75% (IQ3) | 98.5% | 98.8% |
| Interquartile Range (IQR) | 3.0% | 1.8% |
| Standard Deviation (Sample) | 2.2% | 2.3% |
| Standard Deviation (Population) | 2.2% | 2.2% |
Similar Demographics by 8th Grade
Demographics Similar to Assyrians/Chaldeans/Syriacs by 8th Grade
In terms of 8th grade, the demographic groups most similar to Assyrians/Chaldeans/Syriacs are Sierra Leonean (95.6%, a difference of 0.0%), Immigrants from Zaire (95.6%, a difference of 0.010%), Guamanian/Chamorro (95.6%, a difference of 0.020%), Paraguayan (95.5%, a difference of 0.020%), and Immigrants from Northern Africa (95.5%, a difference of 0.020%).
| Demographics | Rating | Rank | 8th Grade |
| Immigrants | Micronesia | 31.6 /100 | #189 | Fair 95.6% |
| Immigrants | Venezuela | 30.8 /100 | #190 | Fair 95.6% |
| Immigrants | Nepal | 30.2 /100 | #191 | Fair 95.6% |
| Pima | 28.6 /100 | #192 | Fair 95.6% |
| Panamanians | 28.4 /100 | #193 | Fair 95.6% |
| Guamanians/Chamorros | 26.6 /100 | #194 | Fair 95.6% |
| Immigrants | Zaire | 25.2 /100 | #195 | Fair 95.6% |
| Assyrians/Chaldeans/Syriacs | 24.5 /100 | #196 | Fair 95.6% |
| Sierra Leoneans | 24.3 /100 | #197 | Fair 95.6% |
| Paraguayans | 22.6 /100 | #198 | Fair 95.5% |
| Immigrants | Northern Africa | 22.5 /100 | #199 | Fair 95.5% |
| Argentineans | 22.2 /100 | #200 | Fair 95.5% |
| Immigrants | Argentina | 20.6 /100 | #201 | Fair 95.5% |
| Apache | 19.4 /100 | #202 | Poor 95.5% |
| Moroccans | 17.4 /100 | #203 | Poor 95.5% |
Demographics Similar to Creek by 8th Grade
In terms of 8th grade, the demographic groups most similar to Creek are American (96.6%, a difference of 0.0%), Iranian (96.6%, a difference of 0.010%), Immigrants from India (96.6%, a difference of 0.020%), Native Hawaiian (96.6%, a difference of 0.020%), and Canadian (96.6%, a difference of 0.020%).
| Demographics | Rating | Rank | 8th Grade |
| Immigrants | Austria | 99.8 /100 | #61 | Exceptional 96.7% |
| Whites/Caucasians | 99.8 /100 | #62 | Exceptional 96.7% |
| Ukrainians | 99.7 /100 | #63 | Exceptional 96.7% |
| Immigrants | India | 99.7 /100 | #64 | Exceptional 96.6% |
| Native Hawaiians | 99.7 /100 | #65 | Exceptional 96.6% |
| Canadians | 99.7 /100 | #66 | Exceptional 96.6% |
| Iranians | 99.7 /100 | #67 | Exceptional 96.6% |
| Creek | 99.7 /100 | #68 | Exceptional 96.6% |
| Americans | 99.7 /100 | #69 | Exceptional 96.6% |
| Immigrants | Lithuania | 99.6 /100 | #70 | Exceptional 96.6% |
| New Zealanders | 99.5 /100 | #71 | Exceptional 96.6% |
| Immigrants | England | 99.5 /100 | #72 | Exceptional 96.6% |
| Arapaho | 99.5 /100 | #73 | Exceptional 96.6% |
| Immigrants | Ireland | 99.5 /100 | #74 | Exceptional 96.5% |
| Zimbabweans | 99.4 /100 | #75 | Exceptional 96.5% |