Immigrants from Mexico vs Creek Median Female Earnings
COMPARE
Immigrants from Mexico
Creek
Median Female Earnings
Median Female Earnings Comparison
Immigrants from Mexico
Creek
$33,236
MEDIAN FEMALE EARNINGS
0.0/ 100
METRIC RATING
339th/ 347
METRIC RANK
$33,437
MEDIAN FEMALE EARNINGS
0.0/ 100
METRIC RATING
335th/ 347
METRIC RANK
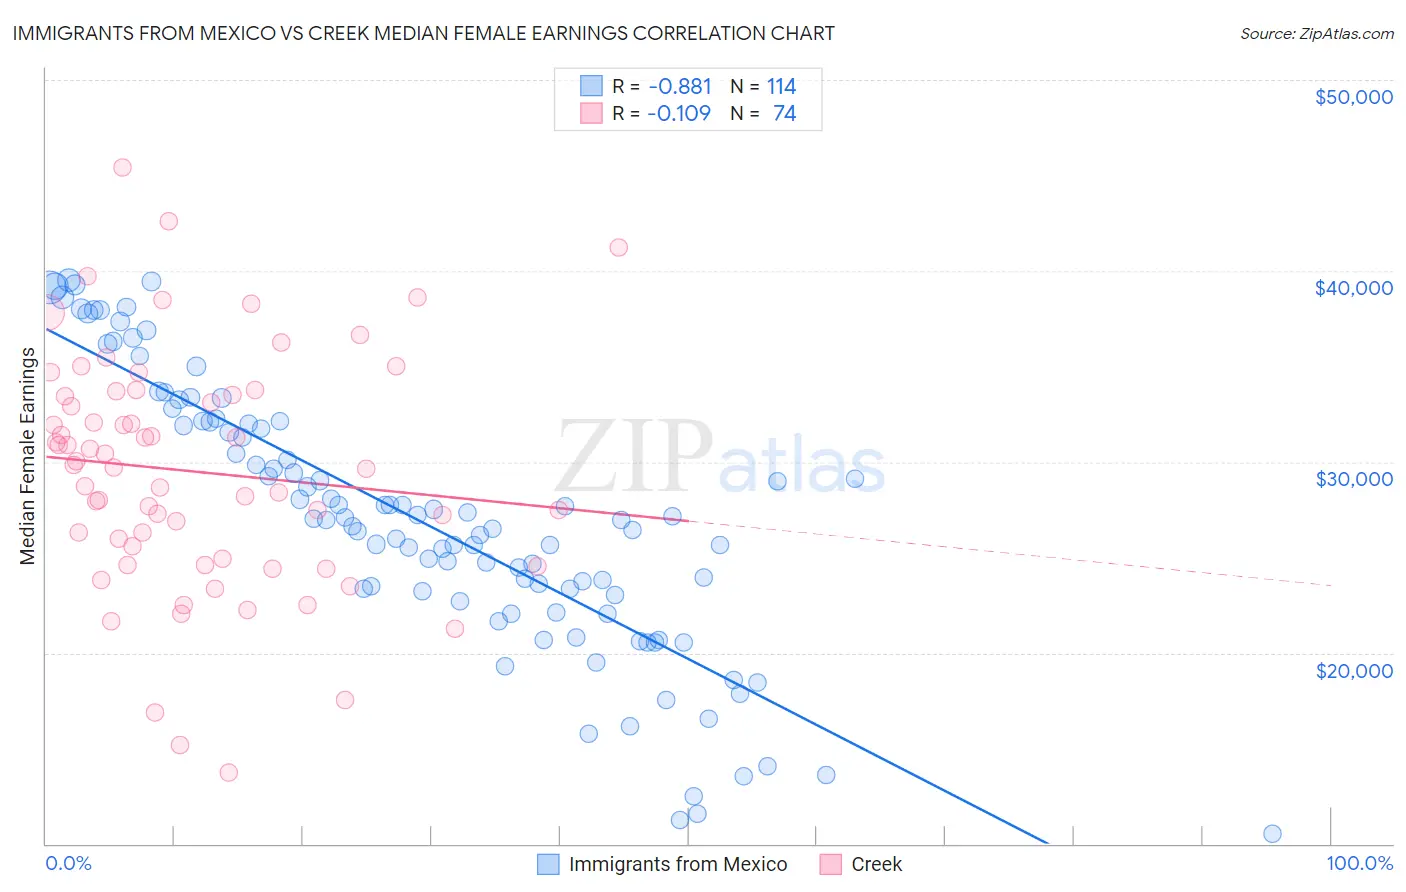
Immigrants from Mexico vs Creek Median Female Earnings Correlation Chart
The statistical analysis conducted on geographies consisting of 512,787,138 people shows a very strong negative correlation between the proportion of Immigrants from Mexico and median female earnings in the United States with a correlation coefficient (R) of -0.881 and weighted average of $33,236. Similarly, the statistical analysis conducted on geographies consisting of 178,409,483 people shows a poor negative correlation between the proportion of Creek and median female earnings in the United States with a correlation coefficient (R) of -0.109 and weighted average of $33,437, a difference of 0.61%.
Median Female Earnings Correlation Summary
| Measurement | Immigrants from Mexico | Creek |
| Minimum | $10,532 | $13,750 |
| Maximum | $39,508 | $45,402 |
| Range | $28,976 | $31,652 |
| Mean | $26,933 | $29,490 |
| Median | $26,949 | $29,783 |
| Interquartile 25% (IQ1) | $22,999 | $24,936 |
| Interquartile 75% (IQ3) | $32,002 | $33,500 |
| Interquartile Range (IQR) | $9,003 | $8,564 |
| Standard Deviation (Sample) | $6,963 | $6,205 |
| Standard Deviation (Population) | $6,932 | $6,162 |
Demographics Similar to Immigrants from Mexico and Creek by Median Female Earnings
In terms of median female earnings, the demographic groups most similar to Immigrants from Mexico are Tohono O'odham ($33,205, a difference of 0.090%), Immigrants from Cuba ($33,291, a difference of 0.17%), Yakama ($33,354, a difference of 0.36%), Ottawa ($33,378, a difference of 0.43%), and Navajo ($33,046, a difference of 0.57%). Similarly, the demographic groups most similar to Creek are Ottawa ($33,378, a difference of 0.18%), Yakama ($33,354, a difference of 0.25%), Immigrants from Cuba ($33,291, a difference of 0.44%), Spanish American Indian ($33,625, a difference of 0.56%), and Mexican ($33,664, a difference of 0.68%).
| Demographics | Rating | Rank | Median Female Earnings |
| Cajuns | 0.0 /100 | #327 | Tragic $34,034 |
| Immigrants | Central America | 0.0 /100 | #328 | Tragic $33,953 |
| Hopi | 0.0 /100 | #329 | Tragic $33,932 |
| Menominee | 0.0 /100 | #330 | Tragic $33,894 |
| Natives/Alaskans | 0.0 /100 | #331 | Tragic $33,806 |
| Choctaw | 0.0 /100 | #332 | Tragic $33,775 |
| Mexicans | 0.0 /100 | #333 | Tragic $33,664 |
| Spanish American Indians | 0.0 /100 | #334 | Tragic $33,625 |
| Creek | 0.0 /100 | #335 | Tragic $33,437 |
| Ottawa | 0.0 /100 | #336 | Tragic $33,378 |
| Yakama | 0.0 /100 | #337 | Tragic $33,354 |
| Immigrants | Cuba | 0.0 /100 | #338 | Tragic $33,291 |
| Immigrants | Mexico | 0.0 /100 | #339 | Tragic $33,236 |
| Tohono O'odham | 0.0 /100 | #340 | Tragic $33,205 |
| Navajo | 0.0 /100 | #341 | Tragic $33,046 |
| Yup'ik | 0.0 /100 | #342 | Tragic $32,730 |
| Pueblo | 0.0 /100 | #343 | Tragic $32,564 |
| Lumbee | 0.0 /100 | #344 | Tragic $32,500 |
| Puerto Ricans | 0.0 /100 | #345 | Tragic $31,560 |
| Arapaho | 0.0 /100 | #346 | Tragic $31,489 |
| Houma | 0.0 /100 | #347 | Tragic $30,343 |