Russian vs Creek Median Female Earnings
COMPARE
Russian
Creek
Median Female Earnings
Median Female Earnings Comparison
Russians
Creek
$44,169
MEDIAN FEMALE EARNINGS
100.0/ 100
METRIC RATING
34th/ 347
METRIC RANK
$33,437
MEDIAN FEMALE EARNINGS
0.0/ 100
METRIC RATING
335th/ 347
METRIC RANK
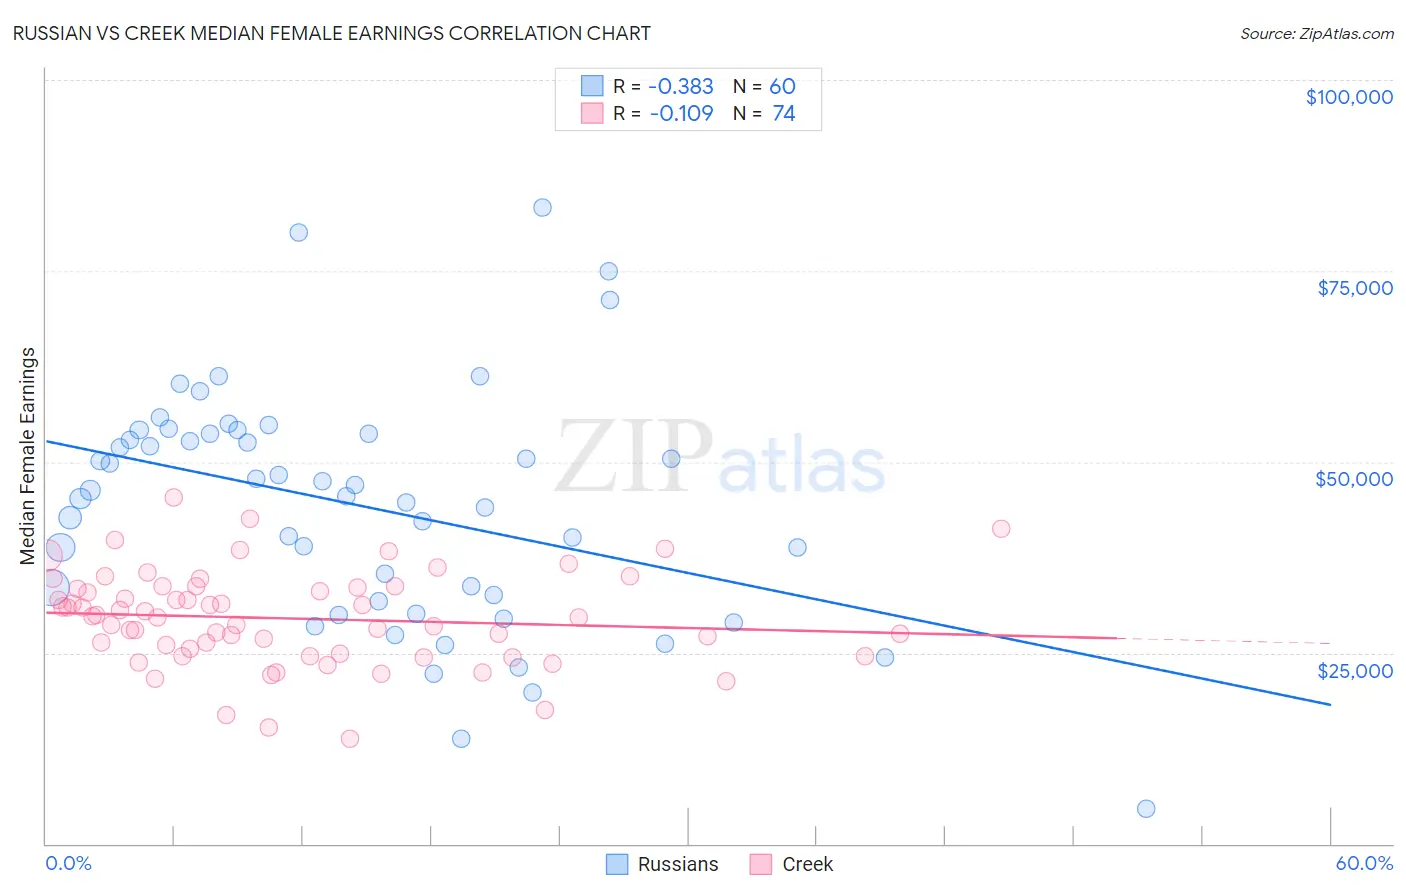
Russian vs Creek Median Female Earnings Correlation Chart
The statistical analysis conducted on geographies consisting of 511,592,990 people shows a mild negative correlation between the proportion of Russians and median female earnings in the United States with a correlation coefficient (R) of -0.383 and weighted average of $44,169. Similarly, the statistical analysis conducted on geographies consisting of 178,409,483 people shows a poor negative correlation between the proportion of Creek and median female earnings in the United States with a correlation coefficient (R) of -0.109 and weighted average of $33,437, a difference of 32.1%.
Median Female Earnings Correlation Summary
| Measurement | Russian | Creek |
| Minimum | $4,625 | $13,750 |
| Maximum | $83,305 | $45,402 |
| Range | $78,680 | $31,652 |
| Mean | $44,153 | $29,490 |
| Median | $45,890 | $29,783 |
| Interquartile 25% (IQ1) | $32,157 | $24,936 |
| Interquartile 75% (IQ3) | $53,697 | $33,500 |
| Interquartile Range (IQR) | $21,540 | $8,564 |
| Standard Deviation (Sample) | $15,453 | $6,205 |
| Standard Deviation (Population) | $15,323 | $6,162 |
Similar Demographics by Median Female Earnings
Demographics Similar to Russians by Median Female Earnings
In terms of median female earnings, the demographic groups most similar to Russians are Immigrants from Sri Lanka ($44,161, a difference of 0.020%), Immigrants from Asia ($44,198, a difference of 0.070%), Immigrants from Turkey ($44,066, a difference of 0.23%), Immigrants from Switzerland ($43,996, a difference of 0.39%), and Immigrants from Northern Europe ($44,366, a difference of 0.44%).
| Demographics | Rating | Rank | Median Female Earnings |
| Turks | 100.0 /100 | #27 | Exceptional $44,695 |
| Immigrants | Russia | 100.0 /100 | #28 | Exceptional $44,680 |
| Immigrants | Belgium | 100.0 /100 | #29 | Exceptional $44,587 |
| Asians | 100.0 /100 | #30 | Exceptional $44,586 |
| Immigrants | France | 100.0 /100 | #31 | Exceptional $44,541 |
| Immigrants | Northern Europe | 100.0 /100 | #32 | Exceptional $44,366 |
| Immigrants | Asia | 100.0 /100 | #33 | Exceptional $44,198 |
| Russians | 100.0 /100 | #34 | Exceptional $44,169 |
| Immigrants | Sri Lanka | 100.0 /100 | #35 | Exceptional $44,161 |
| Immigrants | Turkey | 100.0 /100 | #36 | Exceptional $44,066 |
| Immigrants | Switzerland | 100.0 /100 | #37 | Exceptional $43,996 |
| Latvians | 100.0 /100 | #38 | Exceptional $43,941 |
| Israelis | 100.0 /100 | #39 | Exceptional $43,852 |
| Immigrants | Malaysia | 100.0 /100 | #40 | Exceptional $43,835 |
| Bhutanese | 100.0 /100 | #41 | Exceptional $43,648 |
Demographics Similar to Creek by Median Female Earnings
In terms of median female earnings, the demographic groups most similar to Creek are Ottawa ($33,378, a difference of 0.18%), Yakama ($33,354, a difference of 0.25%), Immigrants from Cuba ($33,291, a difference of 0.44%), Spanish American Indian ($33,625, a difference of 0.56%), and Immigrants from Mexico ($33,236, a difference of 0.61%).
| Demographics | Rating | Rank | Median Female Earnings |
| Immigrants | Central America | 0.0 /100 | #328 | Tragic $33,953 |
| Hopi | 0.0 /100 | #329 | Tragic $33,932 |
| Menominee | 0.0 /100 | #330 | Tragic $33,894 |
| Natives/Alaskans | 0.0 /100 | #331 | Tragic $33,806 |
| Choctaw | 0.0 /100 | #332 | Tragic $33,775 |
| Mexicans | 0.0 /100 | #333 | Tragic $33,664 |
| Spanish American Indians | 0.0 /100 | #334 | Tragic $33,625 |
| Creek | 0.0 /100 | #335 | Tragic $33,437 |
| Ottawa | 0.0 /100 | #336 | Tragic $33,378 |
| Yakama | 0.0 /100 | #337 | Tragic $33,354 |
| Immigrants | Cuba | 0.0 /100 | #338 | Tragic $33,291 |
| Immigrants | Mexico | 0.0 /100 | #339 | Tragic $33,236 |
| Tohono O'odham | 0.0 /100 | #340 | Tragic $33,205 |
| Navajo | 0.0 /100 | #341 | Tragic $33,046 |
| Yup'ik | 0.0 /100 | #342 | Tragic $32,730 |