Dominican vs Creek Median Female Earnings
COMPARE
Dominican
Creek
Median Female Earnings
Median Female Earnings Comparison
Dominicans
Creek
$37,046
MEDIAN FEMALE EARNINGS
0.4/ 100
METRIC RATING
266th/ 347
METRIC RANK
$33,437
MEDIAN FEMALE EARNINGS
0.0/ 100
METRIC RATING
335th/ 347
METRIC RANK
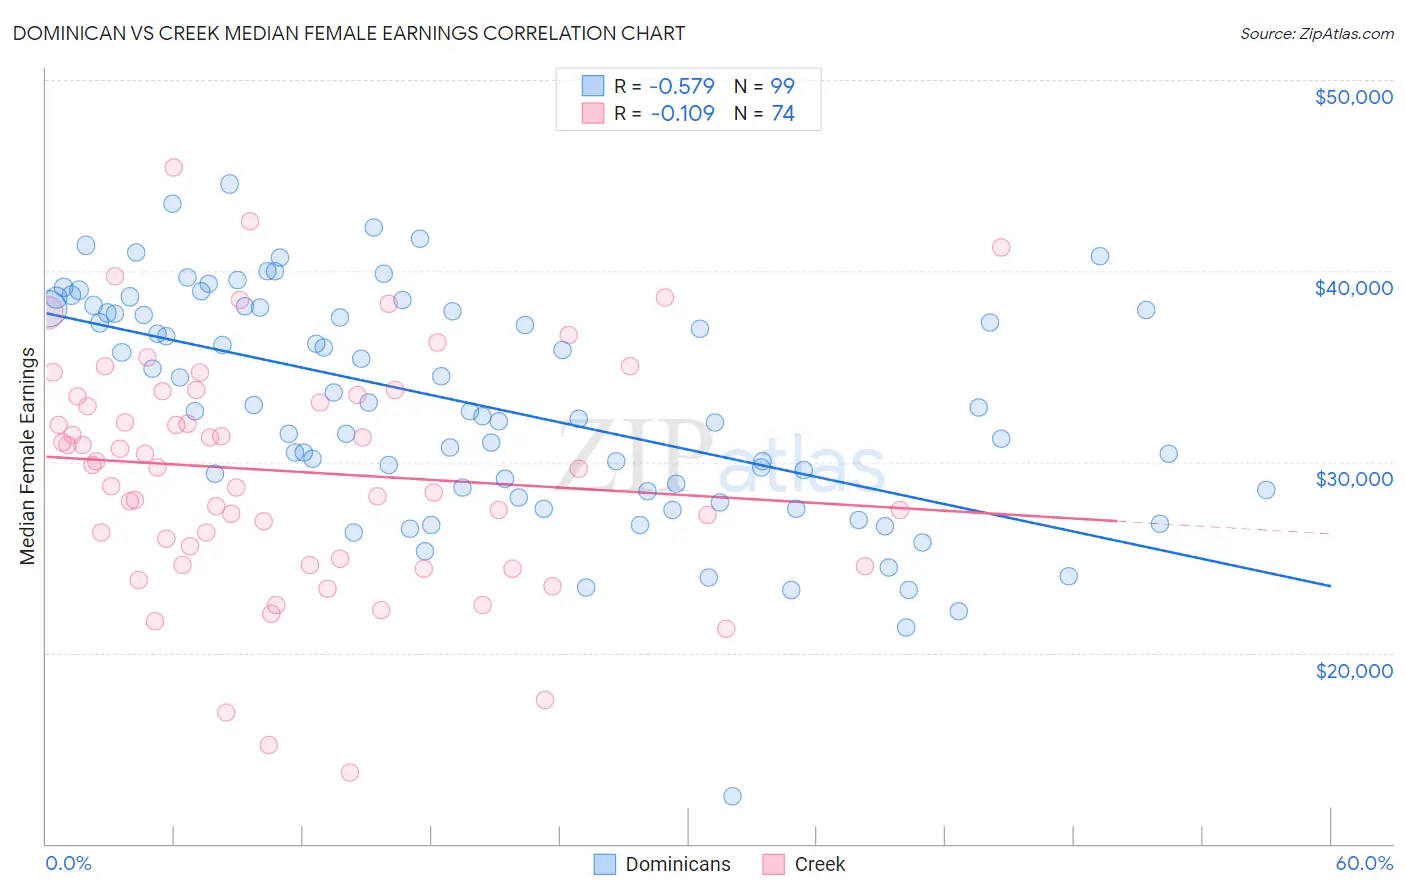
Dominican vs Creek Median Female Earnings Correlation Chart
The statistical analysis conducted on geographies consisting of 355,002,996 people shows a substantial negative correlation between the proportion of Dominicans and median female earnings in the United States with a correlation coefficient (R) of -0.579 and weighted average of $37,046. Similarly, the statistical analysis conducted on geographies consisting of 178,409,483 people shows a poor negative correlation between the proportion of Creek and median female earnings in the United States with a correlation coefficient (R) of -0.109 and weighted average of $33,437, a difference of 10.8%.
Median Female Earnings Correlation Summary
| Measurement | Dominican | Creek |
| Minimum | $12,455 | $13,750 |
| Maximum | $44,571 | $45,402 |
| Range | $32,116 | $31,652 |
| Mean | $32,999 | $29,490 |
| Median | $32,863 | $29,783 |
| Interquartile 25% (IQ1) | $28,508 | $24,936 |
| Interquartile 75% (IQ3) | $38,015 | $33,500 |
| Interquartile Range (IQR) | $9,507 | $8,564 |
| Standard Deviation (Sample) | $5,966 | $6,205 |
| Standard Deviation (Population) | $5,935 | $6,162 |
Similar Demographics by Median Female Earnings
Demographics Similar to Dominicans by Median Female Earnings
In terms of median female earnings, the demographic groups most similar to Dominicans are Immigrants from Belize ($37,056, a difference of 0.030%), Nonimmigrants ($37,024, a difference of 0.060%), Cree ($37,018, a difference of 0.070%), Salvadoran ($37,083, a difference of 0.10%), and Immigrants from Venezuela ($37,003, a difference of 0.12%).
| Demographics | Rating | Rank | Median Female Earnings |
| Scotch-Irish | 0.8 /100 | #259 | Tragic $37,383 |
| Dutch | 0.7 /100 | #260 | Tragic $37,339 |
| Malaysians | 0.7 /100 | #261 | Tragic $37,298 |
| Venezuelans | 0.7 /100 | #262 | Tragic $37,282 |
| German Russians | 0.5 /100 | #263 | Tragic $37,105 |
| Salvadorans | 0.4 /100 | #264 | Tragic $37,083 |
| Immigrants | Belize | 0.4 /100 | #265 | Tragic $37,056 |
| Dominicans | 0.4 /100 | #266 | Tragic $37,046 |
| Immigrants | Nonimmigrants | 0.4 /100 | #267 | Tragic $37,024 |
| Cree | 0.4 /100 | #268 | Tragic $37,018 |
| Immigrants | Venezuela | 0.4 /100 | #269 | Tragic $37,003 |
| French American Indians | 0.3 /100 | #270 | Tragic $36,920 |
| Nicaraguans | 0.3 /100 | #271 | Tragic $36,904 |
| Immigrants | Dominican Republic | 0.3 /100 | #272 | Tragic $36,857 |
| Immigrants | Laos | 0.3 /100 | #273 | Tragic $36,841 |
Demographics Similar to Creek by Median Female Earnings
In terms of median female earnings, the demographic groups most similar to Creek are Ottawa ($33,378, a difference of 0.18%), Yakama ($33,354, a difference of 0.25%), Immigrants from Cuba ($33,291, a difference of 0.44%), Spanish American Indian ($33,625, a difference of 0.56%), and Immigrants from Mexico ($33,236, a difference of 0.61%).
| Demographics | Rating | Rank | Median Female Earnings |
| Immigrants | Central America | 0.0 /100 | #328 | Tragic $33,953 |
| Hopi | 0.0 /100 | #329 | Tragic $33,932 |
| Menominee | 0.0 /100 | #330 | Tragic $33,894 |
| Natives/Alaskans | 0.0 /100 | #331 | Tragic $33,806 |
| Choctaw | 0.0 /100 | #332 | Tragic $33,775 |
| Mexicans | 0.0 /100 | #333 | Tragic $33,664 |
| Spanish American Indians | 0.0 /100 | #334 | Tragic $33,625 |
| Creek | 0.0 /100 | #335 | Tragic $33,437 |
| Ottawa | 0.0 /100 | #336 | Tragic $33,378 |
| Yakama | 0.0 /100 | #337 | Tragic $33,354 |
| Immigrants | Cuba | 0.0 /100 | #338 | Tragic $33,291 |
| Immigrants | Mexico | 0.0 /100 | #339 | Tragic $33,236 |
| Tohono O'odham | 0.0 /100 | #340 | Tragic $33,205 |
| Navajo | 0.0 /100 | #341 | Tragic $33,046 |
| Yup'ik | 0.0 /100 | #342 | Tragic $32,730 |