Aleut vs Immigrants from Kuwait Median Household Income
COMPARE
Aleut
Immigrants from Kuwait
Median Household Income
Median Household Income Comparison
Aleuts
Immigrants from Kuwait
$83,446
MEDIAN HOUSEHOLD INCOME
25.7/ 100
METRIC RATING
197th/ 347
METRIC RANK
$89,263
MEDIAN HOUSEHOLD INCOME
93.5/ 100
METRIC RATING
125th/ 347
METRIC RANK
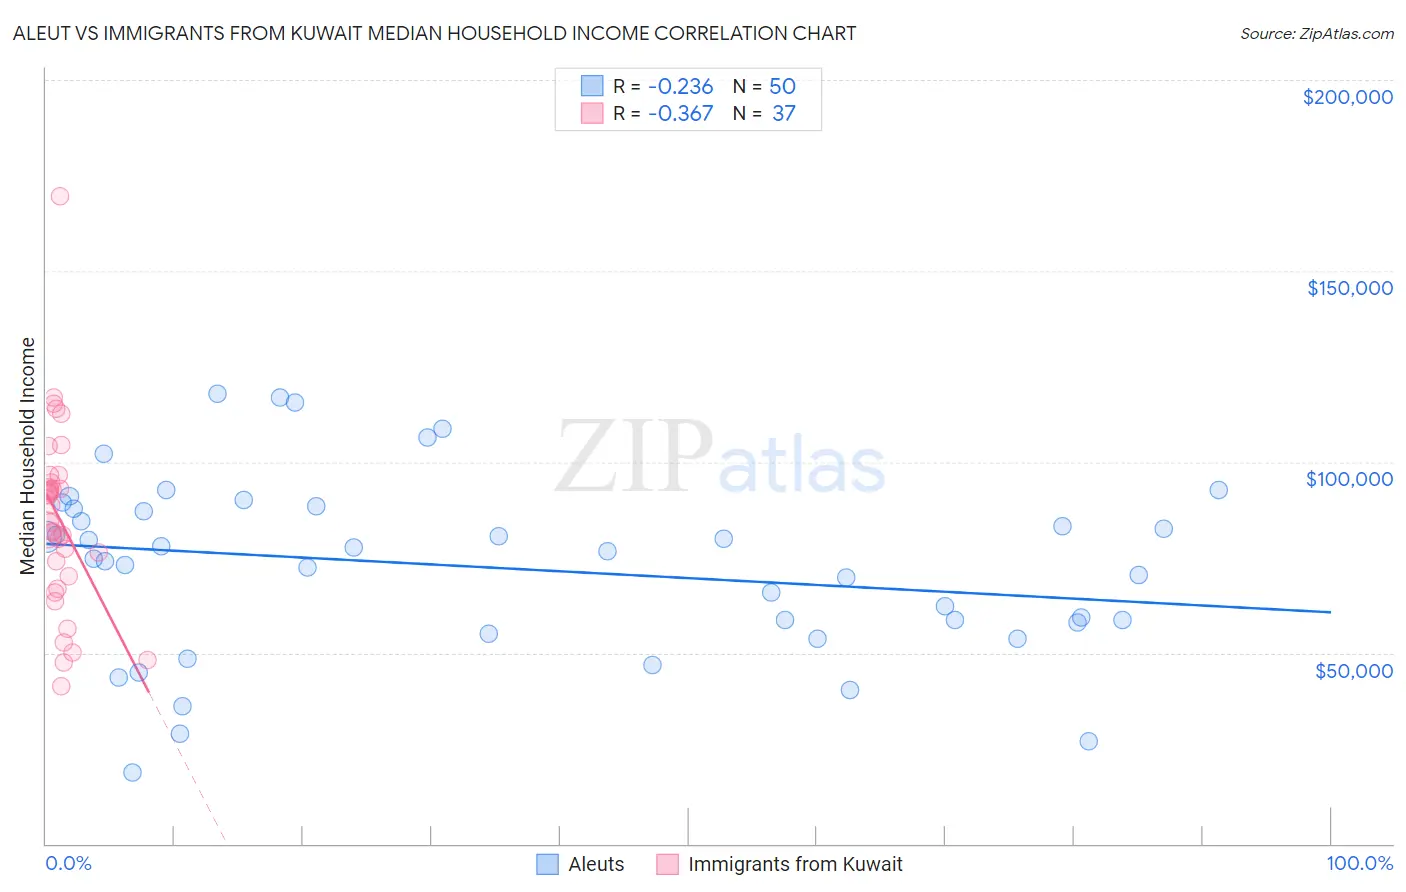
Aleut vs Immigrants from Kuwait Median Household Income Correlation Chart
The statistical analysis conducted on geographies consisting of 61,772,916 people shows a weak negative correlation between the proportion of Aleuts and median household income in the United States with a correlation coefficient (R) of -0.236 and weighted average of $83,446. Similarly, the statistical analysis conducted on geographies consisting of 136,867,834 people shows a mild negative correlation between the proportion of Immigrants from Kuwait and median household income in the United States with a correlation coefficient (R) of -0.367 and weighted average of $89,263, a difference of 7.0%.
Median Household Income Correlation Summary
| Measurement | Aleut | Immigrants from Kuwait |
| Minimum | $18,750 | $41,103 |
| Maximum | $117,969 | $169,621 |
| Range | $99,219 | $128,518 |
| Mean | $72,433 | $84,844 |
| Median | $75,755 | $84,244 |
| Interquartile 25% (IQ1) | $58,000 | $68,396 |
| Interquartile 75% (IQ3) | $87,683 | $95,528 |
| Interquartile Range (IQR) | $29,683 | $27,132 |
| Standard Deviation (Sample) | $23,307 | $24,541 |
| Standard Deviation (Population) | $23,073 | $24,207 |
Similar Demographics by Median Household Income
Demographics Similar to Aleuts by Median Household Income
In terms of median household income, the demographic groups most similar to Aleuts are French ($83,468, a difference of 0.030%), Japanese ($83,395, a difference of 0.060%), German ($83,358, a difference of 0.11%), Tsimshian ($83,346, a difference of 0.12%), and Spanish ($83,343, a difference of 0.12%).
| Demographics | Rating | Rank | Median Household Income |
| Slovaks | 30.2 /100 | #190 | Fair $83,798 |
| Iraqis | 29.6 /100 | #191 | Fair $83,753 |
| Welsh | 28.0 /100 | #192 | Fair $83,628 |
| Finns | 27.7 /100 | #193 | Fair $83,607 |
| Ghanaians | 27.4 /100 | #194 | Fair $83,582 |
| Immigrants | Armenia | 27.0 /100 | #195 | Fair $83,555 |
| French | 26.0 /100 | #196 | Fair $83,468 |
| Aleuts | 25.7 /100 | #197 | Fair $83,446 |
| Japanese | 25.1 /100 | #198 | Fair $83,395 |
| Germans | 24.6 /100 | #199 | Fair $83,358 |
| Tsimshian | 24.5 /100 | #200 | Fair $83,346 |
| Spanish | 24.4 /100 | #201 | Fair $83,343 |
| Immigrants | Thailand | 24.3 /100 | #202 | Fair $83,327 |
| Immigrants | Cambodia | 24.0 /100 | #203 | Fair $83,304 |
| Immigrants | Africa | 23.8 /100 | #204 | Fair $83,289 |
Demographics Similar to Immigrants from Kuwait by Median Household Income
In terms of median household income, the demographic groups most similar to Immigrants from Kuwait are Immigrants from Jordan ($89,412, a difference of 0.17%), Immigrants from Oceania ($89,100, a difference of 0.18%), Immigrants from Zimbabwe ($89,496, a difference of 0.26%), Immigrants from Peru ($89,010, a difference of 0.28%), and Portuguese ($88,976, a difference of 0.32%).
| Demographics | Rating | Rank | Median Household Income |
| Syrians | 95.4 /100 | #118 | Exceptional $89,830 |
| Albanians | 95.2 /100 | #119 | Exceptional $89,744 |
| Immigrants | North Macedonia | 95.2 /100 | #120 | Exceptional $89,741 |
| Ethiopians | 94.9 /100 | #121 | Exceptional $89,640 |
| Pakistanis | 94.8 /100 | #122 | Exceptional $89,638 |
| Immigrants | Zimbabwe | 94.4 /100 | #123 | Exceptional $89,496 |
| Immigrants | Jordan | 94.1 /100 | #124 | Exceptional $89,412 |
| Immigrants | Kuwait | 93.5 /100 | #125 | Exceptional $89,263 |
| Immigrants | Oceania | 92.9 /100 | #126 | Exceptional $89,100 |
| Immigrants | Peru | 92.5 /100 | #127 | Exceptional $89,010 |
| Portuguese | 92.3 /100 | #128 | Exceptional $88,976 |
| Brazilians | 92.1 /100 | #129 | Exceptional $88,934 |
| British | 92.0 /100 | #130 | Exceptional $88,914 |
| Immigrants | Syria | 91.4 /100 | #131 | Exceptional $88,792 |
| Europeans | 91.2 /100 | #132 | Exceptional $88,751 |