Ugandan vs Immigrants from Kuwait Median Household Income
COMPARE
Ugandan
Immigrants from Kuwait
Median Household Income
Median Household Income Comparison
Ugandans
Immigrants from Kuwait
$87,557
MEDIAN HOUSEHOLD INCOME
82.9/ 100
METRIC RATING
145th/ 347
METRIC RANK
$89,263
MEDIAN HOUSEHOLD INCOME
93.5/ 100
METRIC RATING
125th/ 347
METRIC RANK
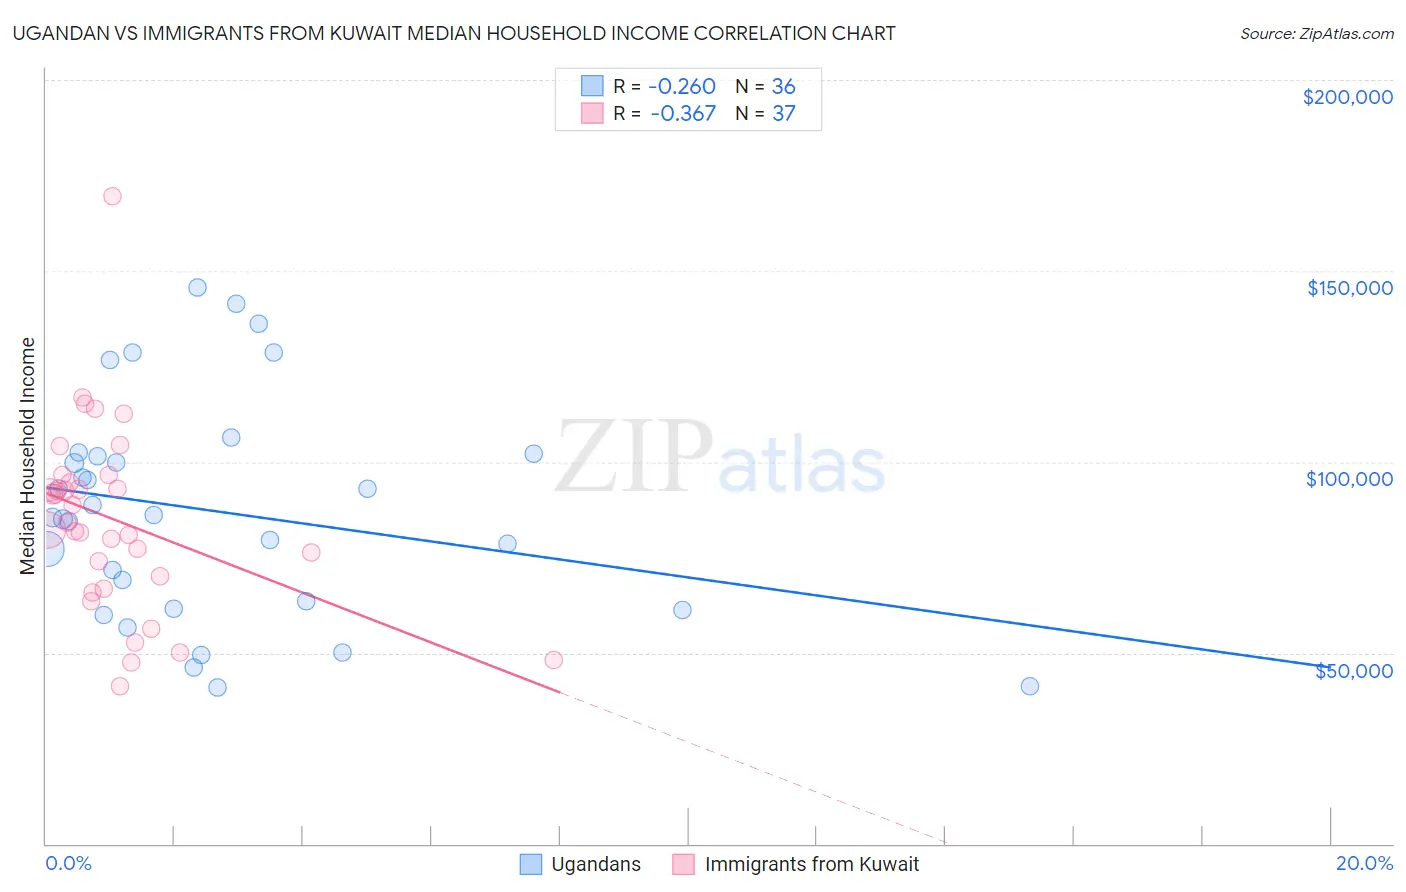
Ugandan vs Immigrants from Kuwait Median Household Income Correlation Chart
The statistical analysis conducted on geographies consisting of 93,988,402 people shows a weak negative correlation between the proportion of Ugandans and median household income in the United States with a correlation coefficient (R) of -0.260 and weighted average of $87,557. Similarly, the statistical analysis conducted on geographies consisting of 136,867,834 people shows a mild negative correlation between the proportion of Immigrants from Kuwait and median household income in the United States with a correlation coefficient (R) of -0.367 and weighted average of $89,263, a difference of 1.9%.
Median Household Income Correlation Summary
| Measurement | Ugandan | Immigrants from Kuwait |
| Minimum | $40,977 | $41,103 |
| Maximum | $145,769 | $169,621 |
| Range | $104,792 | $128,518 |
| Mean | $87,043 | $84,844 |
| Median | $85,898 | $84,244 |
| Interquartile 25% (IQ1) | $62,590 | $68,396 |
| Interquartile 75% (IQ3) | $101,783 | $95,528 |
| Interquartile Range (IQR) | $39,193 | $27,132 |
| Standard Deviation (Sample) | $28,515 | $24,541 |
| Standard Deviation (Population) | $28,116 | $24,207 |
Demographics Similar to Ugandans and Immigrants from Kuwait by Median Household Income
In terms of median household income, the demographic groups most similar to Ugandans are Serbian ($87,572, a difference of 0.020%), Danish ($87,676, a difference of 0.14%), Canadian ($87,769, a difference of 0.24%), Immigrants from Morocco ($87,930, a difference of 0.43%), and Lebanese ($88,091, a difference of 0.61%). Similarly, the demographic groups most similar to Immigrants from Kuwait are Immigrants from Oceania ($89,100, a difference of 0.18%), Immigrants from Peru ($89,010, a difference of 0.28%), Portuguese ($88,976, a difference of 0.32%), Brazilian ($88,934, a difference of 0.37%), and British ($88,914, a difference of 0.39%).
| Demographics | Rating | Rank | Median Household Income |
| Immigrants | Kuwait | 93.5 /100 | #125 | Exceptional $89,263 |
| Immigrants | Oceania | 92.9 /100 | #126 | Exceptional $89,100 |
| Immigrants | Peru | 92.5 /100 | #127 | Exceptional $89,010 |
| Portuguese | 92.3 /100 | #128 | Exceptional $88,976 |
| Brazilians | 92.1 /100 | #129 | Exceptional $88,934 |
| British | 92.0 /100 | #130 | Exceptional $88,914 |
| Immigrants | Syria | 91.4 /100 | #131 | Exceptional $88,792 |
| Europeans | 91.2 /100 | #132 | Exceptional $88,751 |
| Immigrants | Ethiopia | 90.9 /100 | #133 | Exceptional $88,687 |
| Swedes | 90.0 /100 | #134 | Exceptional $88,524 |
| Immigrants | Sierra Leone | 89.9 /100 | #135 | Excellent $88,498 |
| Poles | 89.7 /100 | #136 | Excellent $88,472 |
| Sierra Leoneans | 89.6 /100 | #137 | Excellent $88,463 |
| Arabs | 89.2 /100 | #138 | Excellent $88,398 |
| Immigrants | Chile | 89.2 /100 | #139 | Excellent $88,388 |
| Lebanese | 87.2 /100 | #140 | Excellent $88,091 |
| Immigrants | Morocco | 86.0 /100 | #141 | Excellent $87,930 |
| Canadians | 84.7 /100 | #142 | Excellent $87,769 |
| Danes | 83.9 /100 | #143 | Excellent $87,676 |
| Serbians | 83.0 /100 | #144 | Excellent $87,572 |
| Ugandans | 82.9 /100 | #145 | Excellent $87,557 |