Dutch vs Immigrants from Kuwait Median Household Income
COMPARE
Dutch
Immigrants from Kuwait
Median Household Income
Median Household Income Comparison
Dutch
Immigrants from Kuwait
$82,971
MEDIAN HOUSEHOLD INCOME
20.3/ 100
METRIC RATING
207th/ 347
METRIC RANK
$89,263
MEDIAN HOUSEHOLD INCOME
93.5/ 100
METRIC RATING
125th/ 347
METRIC RANK
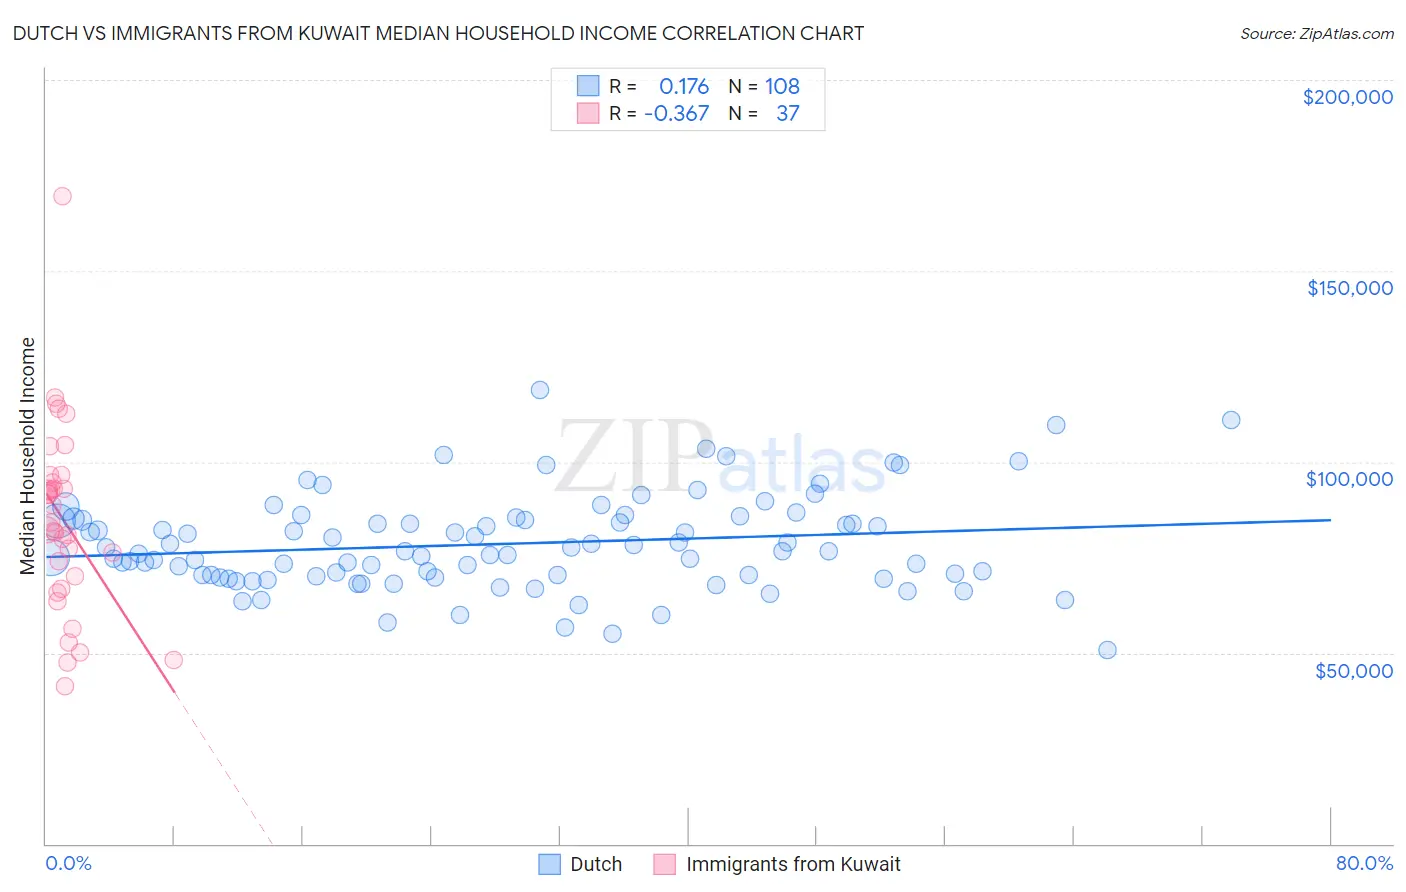
Dutch vs Immigrants from Kuwait Median Household Income Correlation Chart
The statistical analysis conducted on geographies consisting of 553,516,868 people shows a poor positive correlation between the proportion of Dutch and median household income in the United States with a correlation coefficient (R) of 0.176 and weighted average of $82,971. Similarly, the statistical analysis conducted on geographies consisting of 136,867,834 people shows a mild negative correlation between the proportion of Immigrants from Kuwait and median household income in the United States with a correlation coefficient (R) of -0.367 and weighted average of $89,263, a difference of 7.6%.
Median Household Income Correlation Summary
| Measurement | Dutch | Immigrants from Kuwait |
| Minimum | $50,679 | $41,103 |
| Maximum | $118,750 | $169,621 |
| Range | $68,071 | $128,518 |
| Mean | $78,501 | $84,844 |
| Median | $76,487 | $84,244 |
| Interquartile 25% (IQ1) | $70,197 | $68,396 |
| Interquartile 75% (IQ3) | $84,813 | $95,528 |
| Interquartile Range (IQR) | $14,616 | $27,132 |
| Standard Deviation (Sample) | $12,272 | $24,541 |
| Standard Deviation (Population) | $12,215 | $24,207 |
Similar Demographics by Median Household Income
Demographics Similar to Dutch by Median Household Income
In terms of median household income, the demographic groups most similar to Dutch are Immigrants from Kenya ($83,068, a difference of 0.12%), French Canadian ($82,810, a difference of 0.19%), Celtic ($83,193, a difference of 0.27%), Immigrants from Africa ($83,289, a difference of 0.38%), and Immigrants from Cambodia ($83,304, a difference of 0.40%).
| Demographics | Rating | Rank | Median Household Income |
| Tsimshian | 24.5 /100 | #200 | Fair $83,346 |
| Spanish | 24.4 /100 | #201 | Fair $83,343 |
| Immigrants | Thailand | 24.3 /100 | #202 | Fair $83,327 |
| Immigrants | Cambodia | 24.0 /100 | #203 | Fair $83,304 |
| Immigrants | Africa | 23.8 /100 | #204 | Fair $83,289 |
| Celtics | 22.7 /100 | #205 | Fair $83,193 |
| Immigrants | Kenya | 21.3 /100 | #206 | Fair $83,068 |
| Dutch | 20.3 /100 | #207 | Fair $82,971 |
| French Canadians | 18.7 /100 | #208 | Poor $82,810 |
| Immigrants | Iraq | 16.7 /100 | #209 | Poor $82,594 |
| Immigrants | Uruguay | 16.4 /100 | #210 | Poor $82,560 |
| Salvadorans | 15.4 /100 | #211 | Poor $82,449 |
| Venezuelans | 15.3 /100 | #212 | Poor $82,432 |
| Nepalese | 15.1 /100 | #213 | Poor $82,410 |
| Panamanians | 14.0 /100 | #214 | Poor $82,272 |
Demographics Similar to Immigrants from Kuwait by Median Household Income
In terms of median household income, the demographic groups most similar to Immigrants from Kuwait are Immigrants from Jordan ($89,412, a difference of 0.17%), Immigrants from Oceania ($89,100, a difference of 0.18%), Immigrants from Zimbabwe ($89,496, a difference of 0.26%), Immigrants from Peru ($89,010, a difference of 0.28%), and Portuguese ($88,976, a difference of 0.32%).
| Demographics | Rating | Rank | Median Household Income |
| Syrians | 95.4 /100 | #118 | Exceptional $89,830 |
| Albanians | 95.2 /100 | #119 | Exceptional $89,744 |
| Immigrants | North Macedonia | 95.2 /100 | #120 | Exceptional $89,741 |
| Ethiopians | 94.9 /100 | #121 | Exceptional $89,640 |
| Pakistanis | 94.8 /100 | #122 | Exceptional $89,638 |
| Immigrants | Zimbabwe | 94.4 /100 | #123 | Exceptional $89,496 |
| Immigrants | Jordan | 94.1 /100 | #124 | Exceptional $89,412 |
| Immigrants | Kuwait | 93.5 /100 | #125 | Exceptional $89,263 |
| Immigrants | Oceania | 92.9 /100 | #126 | Exceptional $89,100 |
| Immigrants | Peru | 92.5 /100 | #127 | Exceptional $89,010 |
| Portuguese | 92.3 /100 | #128 | Exceptional $88,976 |
| Brazilians | 92.1 /100 | #129 | Exceptional $88,934 |
| British | 92.0 /100 | #130 | Exceptional $88,914 |
| Immigrants | Syria | 91.4 /100 | #131 | Exceptional $88,792 |
| Europeans | 91.2 /100 | #132 | Exceptional $88,751 |