Asian vs Alaska Native Doctorate Degree
COMPARE
Asian
Alaska Native
Doctorate Degree
Doctorate Degree Comparison
Asians
Alaska Natives
2.4%
DOCTORATE DEGREE
100.0/ 100
METRIC RATING
48th/ 347
METRIC RANK
1.4%
DOCTORATE DEGREE
0.3/ 100
METRIC RATING
292nd/ 347
METRIC RANK
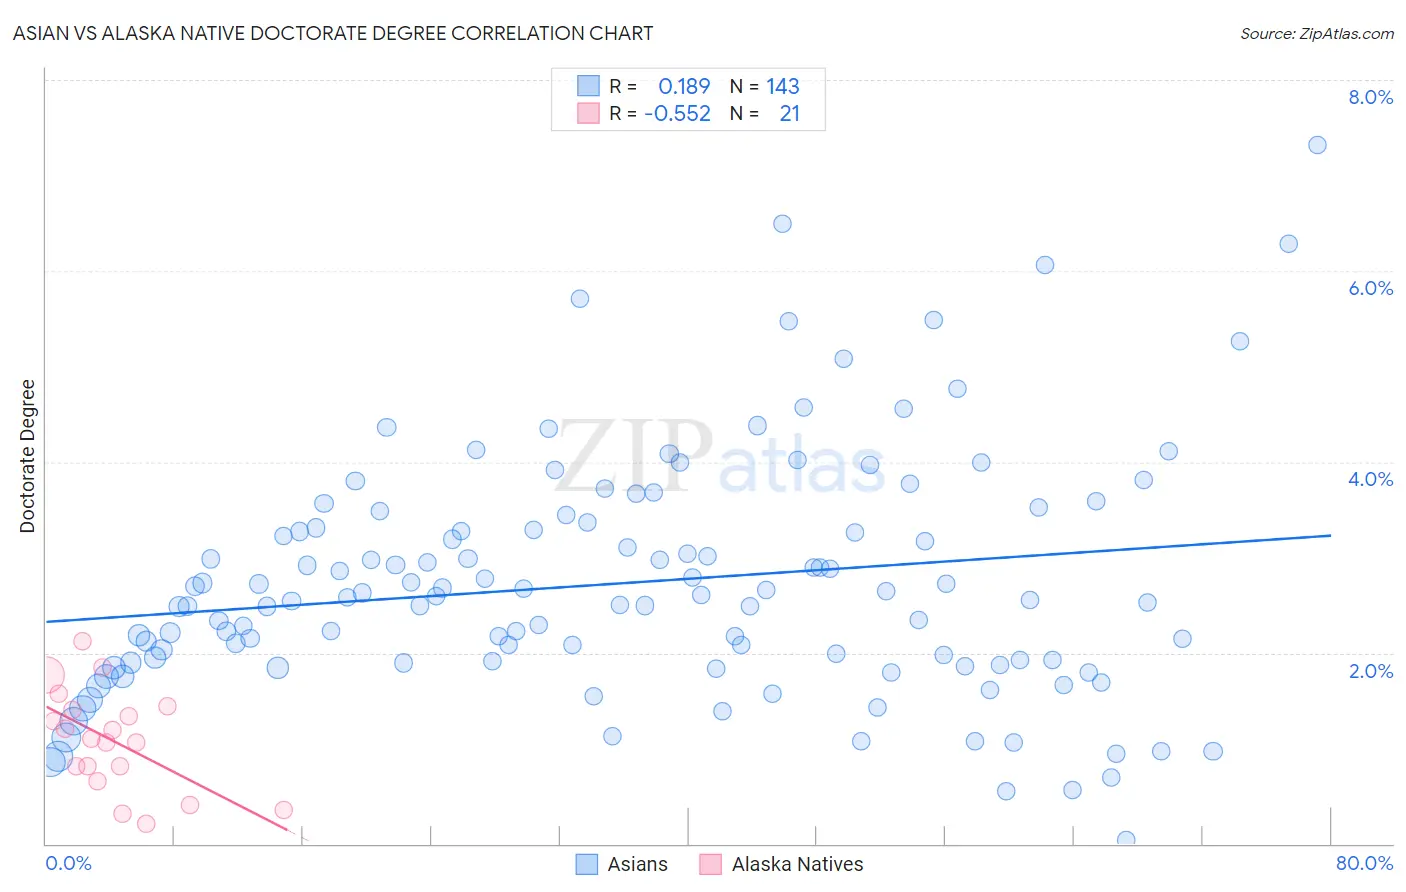
Asian vs Alaska Native Doctorate Degree Correlation Chart
The statistical analysis conducted on geographies consisting of 534,469,334 people shows a poor positive correlation between the proportion of Asians and percentage of population with at least doctorate degree education in the United States with a correlation coefficient (R) of 0.189 and weighted average of 2.4%. Similarly, the statistical analysis conducted on geographies consisting of 76,370,977 people shows a substantial negative correlation between the proportion of Alaska Natives and percentage of population with at least doctorate degree education in the United States with a correlation coefficient (R) of -0.552 and weighted average of 1.4%, a difference of 68.7%.
Doctorate Degree Correlation Summary
| Measurement | Asian | Alaska Native |
| Minimum | 0.043% | 0.21% |
| Maximum | 7.3% | 2.1% |
| Range | 7.3% | 1.9% |
| Mean | 2.7% | 1.1% |
| Median | 2.6% | 1.1% |
| Interquartile 25% (IQ1) | 1.9% | 0.73% |
| Interquartile 75% (IQ3) | 3.3% | 1.4% |
| Interquartile Range (IQR) | 1.4% | 0.69% |
| Standard Deviation (Sample) | 1.3% | 0.53% |
| Standard Deviation (Population) | 1.3% | 0.51% |
Similar Demographics by Doctorate Degree
Demographics Similar to Asians by Doctorate Degree
In terms of doctorate degree, the demographic groups most similar to Asians are Immigrants from Asia (2.4%, a difference of 0.13%), Immigrants from Western Europe (2.4%, a difference of 0.21%), Immigrants from Austria (2.4%, a difference of 0.44%), Immigrants from South Africa (2.4%, a difference of 0.57%), and Immigrants from Norway (2.4%, a difference of 1.3%).
| Demographics | Rating | Rank | Doctorate Degree |
| Immigrants | Russia | 100.0 /100 | #41 | Exceptional 2.5% |
| New Zealanders | 100.0 /100 | #42 | Exceptional 2.5% |
| Soviet Union | 100.0 /100 | #43 | Exceptional 2.5% |
| Immigrants | Netherlands | 100.0 /100 | #44 | Exceptional 2.5% |
| Immigrants | South Africa | 100.0 /100 | #45 | Exceptional 2.4% |
| Immigrants | Austria | 100.0 /100 | #46 | Exceptional 2.4% |
| Immigrants | Western Europe | 100.0 /100 | #47 | Exceptional 2.4% |
| Asians | 100.0 /100 | #48 | Exceptional 2.4% |
| Immigrants | Asia | 100.0 /100 | #49 | Exceptional 2.4% |
| Immigrants | Norway | 100.0 /100 | #50 | Exceptional 2.4% |
| Australians | 100.0 /100 | #51 | Exceptional 2.4% |
| Bulgarians | 100.0 /100 | #52 | Exceptional 2.4% |
| Immigrants | Latvia | 100.0 /100 | #53 | Exceptional 2.4% |
| Immigrants | Indonesia | 100.0 /100 | #54 | Exceptional 2.4% |
| Bolivians | 100.0 /100 | #55 | Exceptional 2.4% |
Demographics Similar to Alaska Natives by Doctorate Degree
In terms of doctorate degree, the demographic groups most similar to Alaska Natives are Black/African American (1.4%, a difference of 0.17%), Choctaw (1.4%, a difference of 0.40%), Cape Verdean (1.4%, a difference of 0.42%), Immigrants from El Salvador (1.4%, a difference of 0.55%), and Immigrants from Yemen (1.4%, a difference of 0.59%).
| Demographics | Rating | Rank | Doctorate Degree |
| Malaysians | 0.3 /100 | #285 | Tragic 1.5% |
| Cherokee | 0.3 /100 | #286 | Tragic 1.5% |
| Cajuns | 0.3 /100 | #287 | Tragic 1.5% |
| Immigrants | El Salvador | 0.3 /100 | #288 | Tragic 1.4% |
| Cape Verdeans | 0.3 /100 | #289 | Tragic 1.4% |
| Choctaw | 0.3 /100 | #290 | Tragic 1.4% |
| Blacks/African Americans | 0.3 /100 | #291 | Tragic 1.4% |
| Alaska Natives | 0.3 /100 | #292 | Tragic 1.4% |
| Immigrants | Yemen | 0.2 /100 | #293 | Tragic 1.4% |
| Samoans | 0.2 /100 | #294 | Tragic 1.4% |
| Guatemalans | 0.2 /100 | #295 | Tragic 1.4% |
| Immigrants | Ecuador | 0.2 /100 | #296 | Tragic 1.4% |
| Tsimshian | 0.2 /100 | #297 | Tragic 1.4% |
| Puerto Ricans | 0.1 /100 | #298 | Tragic 1.4% |
| Belizeans | 0.1 /100 | #299 | Tragic 1.4% |