Marshallese vs Alaska Native Median Household Income
COMPARE
Marshallese
Alaska Native
Median Household Income
Median Household Income Comparison
Marshallese
Alaska Natives
$78,930
MEDIAN HOUSEHOLD INCOME
1.9/ 100
METRIC RATING
244th/ 347
METRIC RANK
$79,509
MEDIAN HOUSEHOLD INCOME
2.7/ 100
METRIC RATING
239th/ 347
METRIC RANK
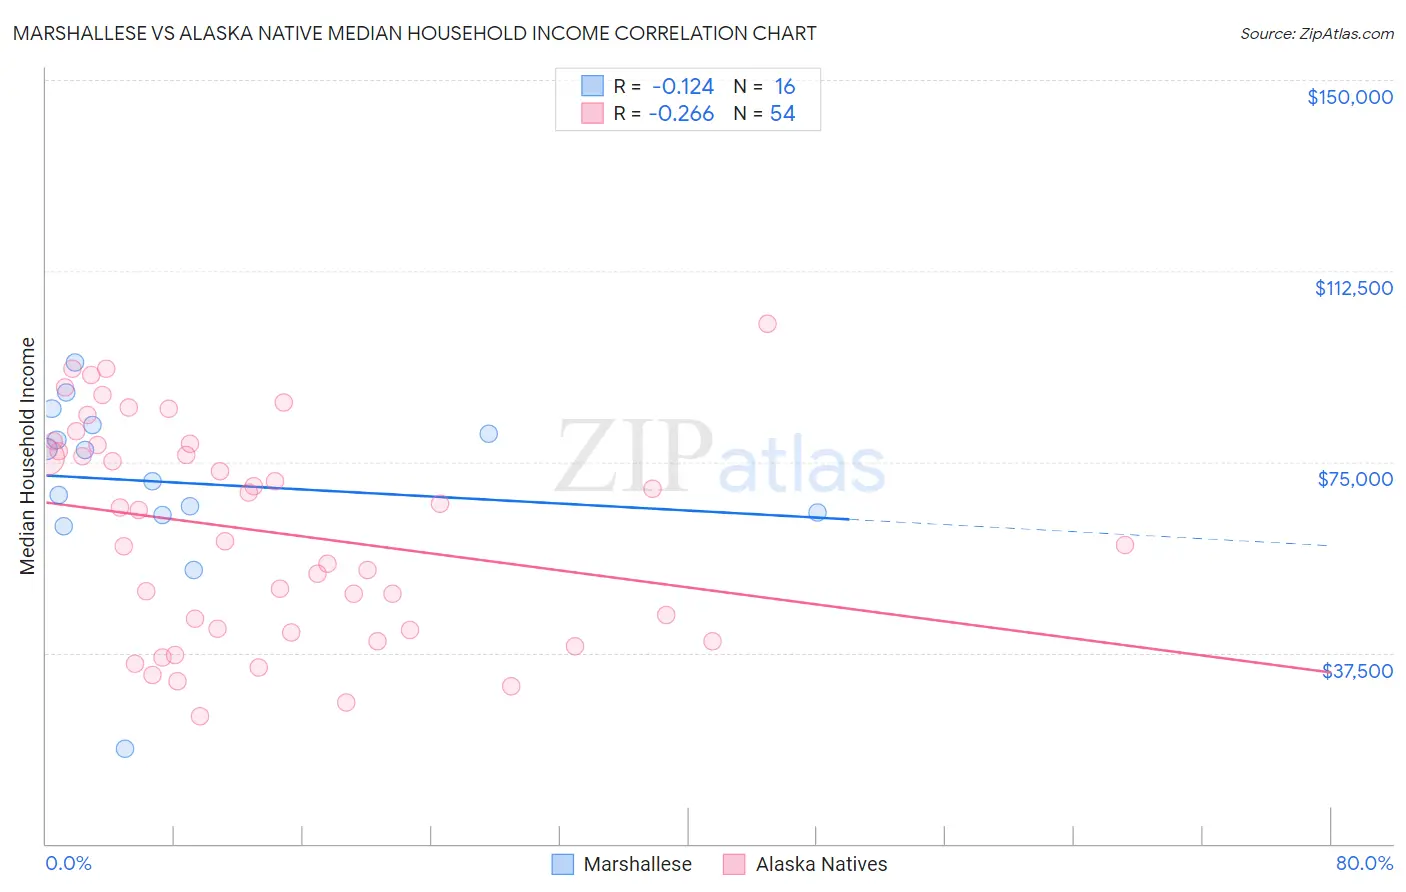
Marshallese vs Alaska Native Median Household Income Correlation Chart
The statistical analysis conducted on geographies consisting of 14,761,315 people shows a poor negative correlation between the proportion of Marshallese and median household income in the United States with a correlation coefficient (R) of -0.124 and weighted average of $78,930. Similarly, the statistical analysis conducted on geographies consisting of 76,748,502 people shows a weak negative correlation between the proportion of Alaska Natives and median household income in the United States with a correlation coefficient (R) of -0.266 and weighted average of $79,509, a difference of 0.73%.
Median Household Income Correlation Summary
| Measurement | Marshallese | Alaska Native |
| Minimum | $18,739 | $25,000 |
| Maximum | $94,608 | $102,083 |
| Range | $75,869 | $77,083 |
| Mean | $71,002 | $61,313 |
| Median | $74,280 | $62,466 |
| Interquartile 25% (IQ1) | $64,792 | $41,964 |
| Interquartile 75% (IQ3) | $81,406 | $78,336 |
| Interquartile Range (IQR) | $16,615 | $36,372 |
| Standard Deviation (Sample) | $17,620 | $20,803 |
| Standard Deviation (Population) | $17,060 | $20,609 |
Demographics Similar to Marshallese and Alaska Natives by Median Household Income
In terms of median household income, the demographic groups most similar to Marshallese are Immigrants from Barbados ($78,989, a difference of 0.080%), Inupiat ($78,841, a difference of 0.11%), Central American ($78,803, a difference of 0.16%), Immigrants from Sudan ($79,103, a difference of 0.22%), and Immigrants from Burma/Myanmar ($78,682, a difference of 0.32%). Similarly, the demographic groups most similar to Alaska Natives are Immigrants from Western Africa ($79,490, a difference of 0.020%), Nonimmigrants ($79,429, a difference of 0.10%), Barbadian ($79,664, a difference of 0.20%), Nicaraguan ($79,737, a difference of 0.29%), and Immigrants from Bosnia and Herzegovina ($79,888, a difference of 0.48%).
| Demographics | Rating | Rank | Median Household Income |
| Trinidadians and Tobagonians | 4.7 /100 | #231 | Tragic $80,402 |
| Immigrants | Trinidad and Tobago | 4.6 /100 | #232 | Tragic $80,373 |
| Immigrants | Azores | 4.5 /100 | #233 | Tragic $80,357 |
| Immigrants | Ecuador | 4.5 /100 | #234 | Tragic $80,341 |
| Immigrants | Guyana | 4.5 /100 | #235 | Tragic $80,324 |
| Immigrants | Bosnia and Herzegovina | 3.4 /100 | #236 | Tragic $79,888 |
| Nicaraguans | 3.1 /100 | #237 | Tragic $79,737 |
| Barbadians | 3.0 /100 | #238 | Tragic $79,664 |
| Alaska Natives | 2.7 /100 | #239 | Tragic $79,509 |
| Immigrants | Western Africa | 2.7 /100 | #240 | Tragic $79,490 |
| Immigrants | Nonimmigrants | 2.6 /100 | #241 | Tragic $79,429 |
| Immigrants | Sudan | 2.1 /100 | #242 | Tragic $79,103 |
| Immigrants | Barbados | 1.9 /100 | #243 | Tragic $78,989 |
| Marshallese | 1.9 /100 | #244 | Tragic $78,930 |
| Inupiat | 1.8 /100 | #245 | Tragic $78,841 |
| Central Americans | 1.7 /100 | #246 | Tragic $78,803 |
| Immigrants | Burma/Myanmar | 1.6 /100 | #247 | Tragic $78,682 |
| Sudanese | 1.5 /100 | #248 | Tragic $78,529 |
| West Indians | 1.4 /100 | #249 | Tragic $78,455 |
| Immigrants | Laos | 1.3 /100 | #250 | Tragic $78,327 |
| Mexican American Indians | 1.2 /100 | #251 | Tragic $78,166 |