Slovak vs Alaska Native Median Household Income
COMPARE
Slovak
Alaska Native
Median Household Income
Median Household Income Comparison
Slovaks
Alaska Natives
$83,798
MEDIAN HOUSEHOLD INCOME
30.2/ 100
METRIC RATING
190th/ 347
METRIC RANK
$79,509
MEDIAN HOUSEHOLD INCOME
2.7/ 100
METRIC RATING
239th/ 347
METRIC RANK
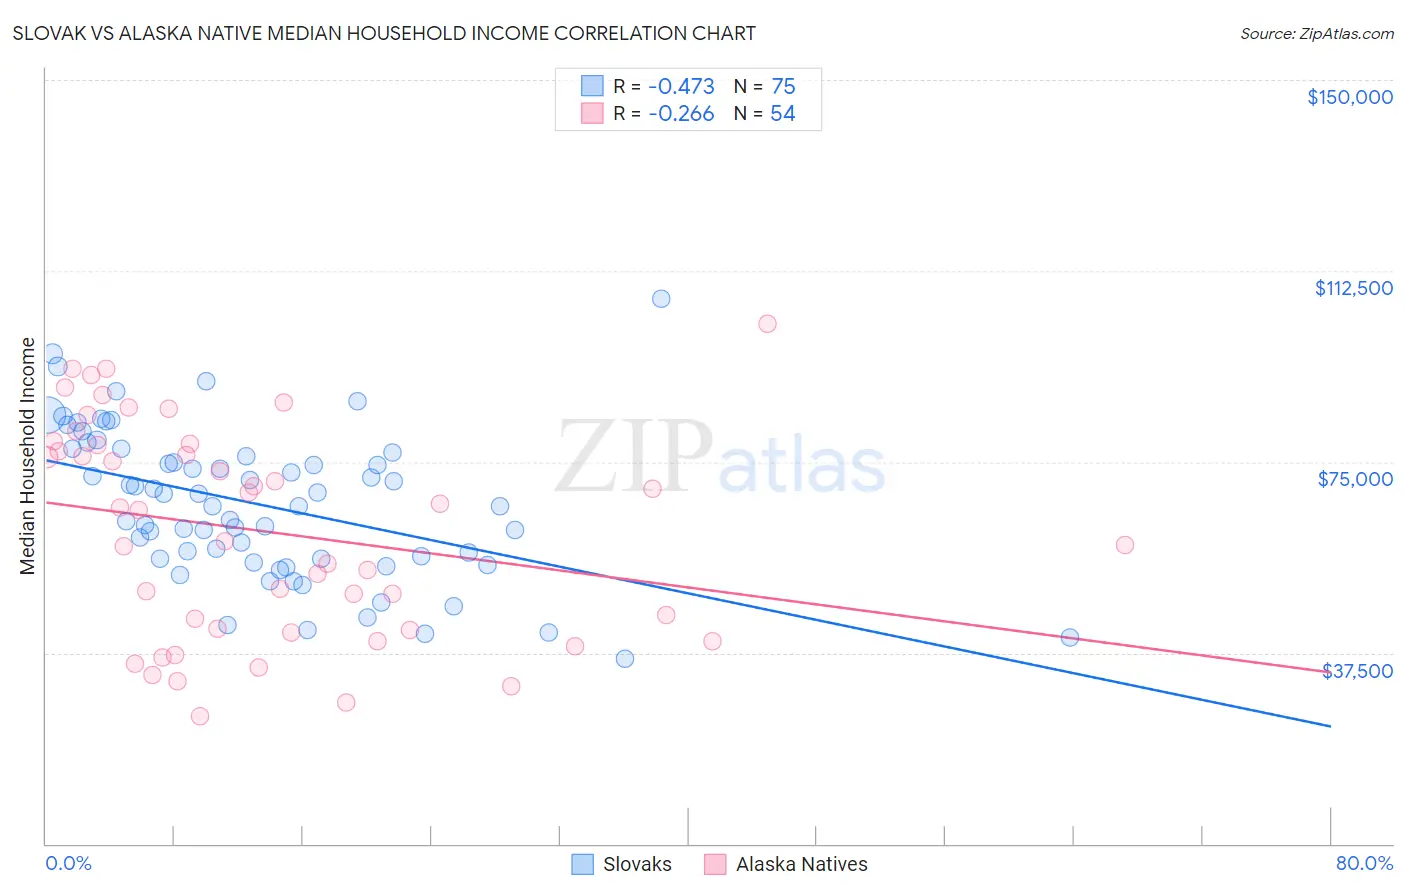
Slovak vs Alaska Native Median Household Income Correlation Chart
The statistical analysis conducted on geographies consisting of 397,588,666 people shows a moderate negative correlation between the proportion of Slovaks and median household income in the United States with a correlation coefficient (R) of -0.473 and weighted average of $83,798. Similarly, the statistical analysis conducted on geographies consisting of 76,748,502 people shows a weak negative correlation between the proportion of Alaska Natives and median household income in the United States with a correlation coefficient (R) of -0.266 and weighted average of $79,509, a difference of 5.4%.
Median Household Income Correlation Summary
| Measurement | Slovak | Alaska Native |
| Minimum | $36,453 | $25,000 |
| Maximum | $106,990 | $102,083 |
| Range | $70,537 | $77,083 |
| Mean | $66,640 | $61,313 |
| Median | $66,359 | $62,466 |
| Interquartile 25% (IQ1) | $55,938 | $41,964 |
| Interquartile 75% (IQ3) | $76,771 | $78,336 |
| Interquartile Range (IQR) | $20,833 | $36,372 |
| Standard Deviation (Sample) | $14,677 | $20,803 |
| Standard Deviation (Population) | $14,579 | $20,609 |
Similar Demographics by Median Household Income
Demographics Similar to Slovaks by Median Household Income
In terms of median household income, the demographic groups most similar to Slovaks are Iraqi ($83,753, a difference of 0.050%), Immigrants from Colombia ($83,902, a difference of 0.12%), Tlingit-Haida ($83,968, a difference of 0.20%), Welsh ($83,628, a difference of 0.20%), and Finnish ($83,607, a difference of 0.23%).
| Demographics | Rating | Rank | Median Household Income |
| Spaniards | 42.7 /100 | #183 | Average $84,644 |
| Immigrants | Eastern Africa | 37.4 /100 | #184 | Fair $84,299 |
| Kenyans | 34.2 /100 | #185 | Fair $84,085 |
| Puget Sound Salish | 33.2 /100 | #186 | Fair $84,011 |
| Belgians | 33.2 /100 | #187 | Fair $84,008 |
| Tlingit-Haida | 32.6 /100 | #188 | Fair $83,968 |
| Immigrants | Colombia | 31.7 /100 | #189 | Fair $83,902 |
| Slovaks | 30.2 /100 | #190 | Fair $83,798 |
| Iraqis | 29.6 /100 | #191 | Fair $83,753 |
| Welsh | 28.0 /100 | #192 | Fair $83,628 |
| Finns | 27.7 /100 | #193 | Fair $83,607 |
| Ghanaians | 27.4 /100 | #194 | Fair $83,582 |
| Immigrants | Armenia | 27.0 /100 | #195 | Fair $83,555 |
| French | 26.0 /100 | #196 | Fair $83,468 |
| Aleuts | 25.7 /100 | #197 | Fair $83,446 |
Demographics Similar to Alaska Natives by Median Household Income
In terms of median household income, the demographic groups most similar to Alaska Natives are Immigrants from Western Africa ($79,490, a difference of 0.020%), Nonimmigrants ($79,429, a difference of 0.10%), Barbadian ($79,664, a difference of 0.20%), Nicaraguan ($79,737, a difference of 0.29%), and Immigrants from Bosnia and Herzegovina ($79,888, a difference of 0.48%).
| Demographics | Rating | Rank | Median Household Income |
| Immigrants | Trinidad and Tobago | 4.6 /100 | #232 | Tragic $80,373 |
| Immigrants | Azores | 4.5 /100 | #233 | Tragic $80,357 |
| Immigrants | Ecuador | 4.5 /100 | #234 | Tragic $80,341 |
| Immigrants | Guyana | 4.5 /100 | #235 | Tragic $80,324 |
| Immigrants | Bosnia and Herzegovina | 3.4 /100 | #236 | Tragic $79,888 |
| Nicaraguans | 3.1 /100 | #237 | Tragic $79,737 |
| Barbadians | 3.0 /100 | #238 | Tragic $79,664 |
| Alaska Natives | 2.7 /100 | #239 | Tragic $79,509 |
| Immigrants | Western Africa | 2.7 /100 | #240 | Tragic $79,490 |
| Immigrants | Nonimmigrants | 2.6 /100 | #241 | Tragic $79,429 |
| Immigrants | Sudan | 2.1 /100 | #242 | Tragic $79,103 |
| Immigrants | Barbados | 1.9 /100 | #243 | Tragic $78,989 |
| Marshallese | 1.9 /100 | #244 | Tragic $78,930 |
| Inupiat | 1.8 /100 | #245 | Tragic $78,841 |
| Central Americans | 1.7 /100 | #246 | Tragic $78,803 |