Arapaho vs Immigrants from Asia Median Family Income
COMPARE
Arapaho
Immigrants from Asia
Median Family Income
Median Family Income Comparison
Arapaho
Immigrants from Asia
$82,064
MEDIAN FAMILY INCOME
0.0/ 100
METRIC RATING
327th/ 347
METRIC RANK
$118,291
MEDIAN FAMILY INCOME
100.0/ 100
METRIC RATING
39th/ 347
METRIC RANK
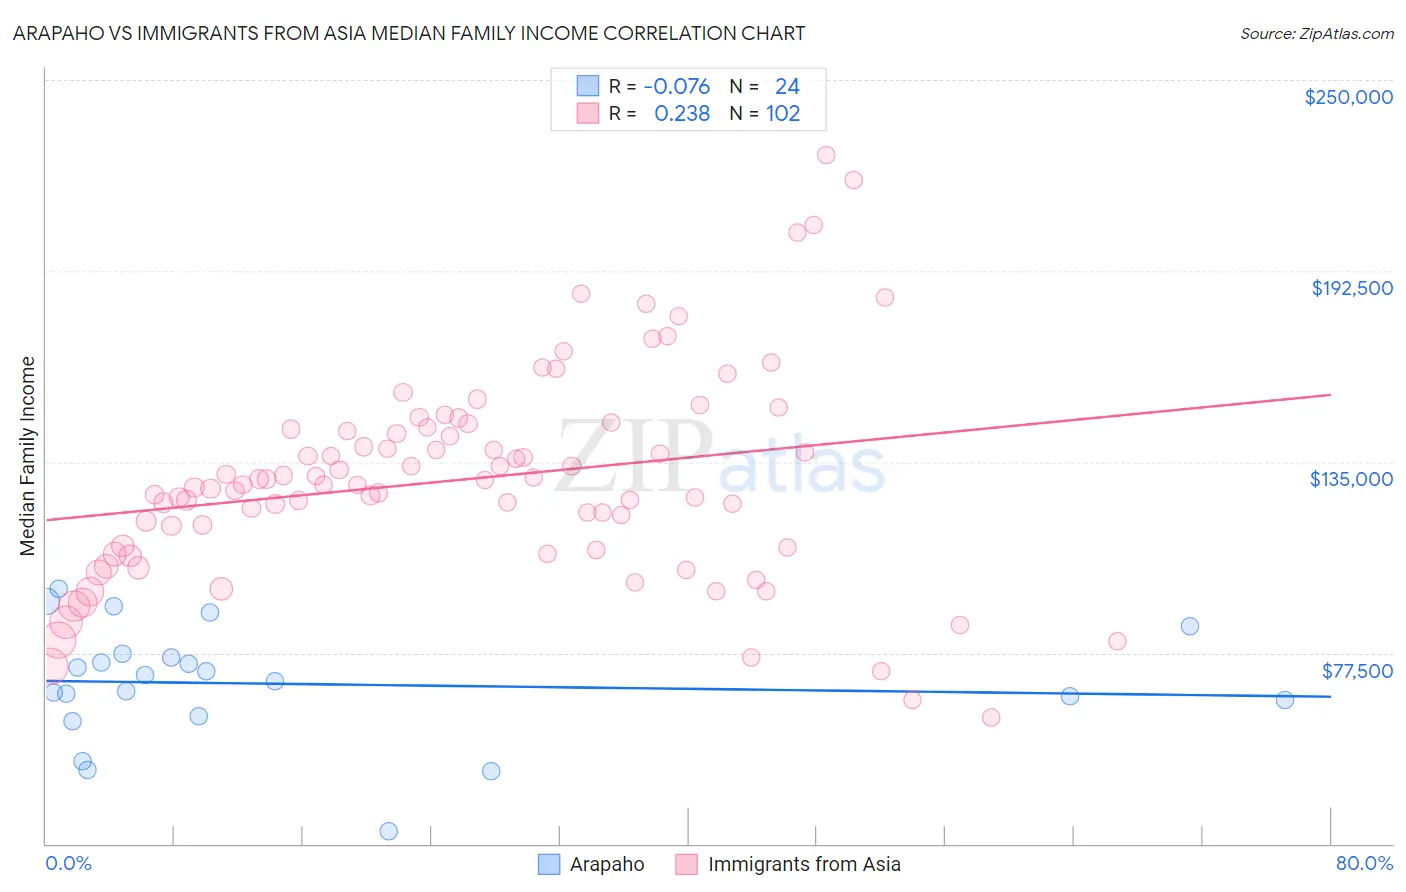
Arapaho vs Immigrants from Asia Median Family Income Correlation Chart
The statistical analysis conducted on geographies consisting of 29,776,303 people shows a slight negative correlation between the proportion of Arapaho and median family income in the United States with a correlation coefficient (R) of -0.076 and weighted average of $82,064. Similarly, the statistical analysis conducted on geographies consisting of 548,079,334 people shows a weak positive correlation between the proportion of Immigrants from Asia and median family income in the United States with a correlation coefficient (R) of 0.238 and weighted average of $118,291, a difference of 44.2%.
Median Family Income Correlation Summary
| Measurement | Arapaho | Immigrants from Asia |
| Minimum | $23,750 | $58,163 |
| Maximum | $96,782 | $227,279 |
| Range | $73,032 | $169,116 |
| Mean | $68,152 | $129,737 |
| Median | $69,777 | $128,095 |
| Interquartile 25% (IQ1) | $60,858 | $109,196 |
| Interquartile 75% (IQ3) | $76,786 | $144,788 |
| Interquartile Range (IQR) | $15,928 | $35,592 |
| Standard Deviation (Sample) | $17,667 | $31,368 |
| Standard Deviation (Population) | $17,295 | $31,213 |
Similar Demographics by Median Family Income
Demographics Similar to Arapaho by Median Family Income
In terms of median family income, the demographic groups most similar to Arapaho are Black/African American ($81,912, a difference of 0.18%), Immigrants from Congo ($82,216, a difference of 0.19%), Dutch West Indian ($81,852, a difference of 0.26%), Sioux ($82,386, a difference of 0.39%), and Creek ($82,560, a difference of 0.61%).
| Demographics | Rating | Rank | Median Family Income |
| Seminole | 0.0 /100 | #320 | Tragic $83,354 |
| Immigrants | Caribbean | 0.0 /100 | #321 | Tragic $83,319 |
| Dominicans | 0.0 /100 | #322 | Tragic $82,888 |
| Bahamians | 0.0 /100 | #323 | Tragic $82,631 |
| Creek | 0.0 /100 | #324 | Tragic $82,560 |
| Sioux | 0.0 /100 | #325 | Tragic $82,386 |
| Immigrants | Congo | 0.0 /100 | #326 | Tragic $82,216 |
| Arapaho | 0.0 /100 | #327 | Tragic $82,064 |
| Blacks/African Americans | 0.0 /100 | #328 | Tragic $81,912 |
| Dutch West Indians | 0.0 /100 | #329 | Tragic $81,852 |
| Cheyenne | 0.0 /100 | #330 | Tragic $81,385 |
| Immigrants | Dominican Republic | 0.0 /100 | #331 | Tragic $81,233 |
| Natives/Alaskans | 0.0 /100 | #332 | Tragic $80,908 |
| Kiowa | 0.0 /100 | #333 | Tragic $80,885 |
| Menominee | 0.0 /100 | #334 | Tragic $79,563 |
Demographics Similar to Immigrants from Asia by Median Family Income
In terms of median family income, the demographic groups most similar to Immigrants from Asia are Immigrants from Turkey ($118,325, a difference of 0.030%), Australian ($118,440, a difference of 0.13%), Immigrants from Lithuania ($118,053, a difference of 0.20%), Israeli ($118,577, a difference of 0.24%), and Estonian ($118,013, a difference of 0.24%).
| Demographics | Rating | Rank | Median Family Income |
| Asians | 100.0 /100 | #32 | Exceptional $119,955 |
| Bhutanese | 100.0 /100 | #33 | Exceptional $119,800 |
| Bolivians | 100.0 /100 | #34 | Exceptional $119,479 |
| Soviet Union | 100.0 /100 | #35 | Exceptional $119,262 |
| Israelis | 100.0 /100 | #36 | Exceptional $118,577 |
| Australians | 100.0 /100 | #37 | Exceptional $118,440 |
| Immigrants | Turkey | 100.0 /100 | #38 | Exceptional $118,325 |
| Immigrants | Asia | 100.0 /100 | #39 | Exceptional $118,291 |
| Immigrants | Lithuania | 100.0 /100 | #40 | Exceptional $118,053 |
| Estonians | 100.0 /100 | #41 | Exceptional $118,013 |
| Immigrants | Bolivia | 100.0 /100 | #42 | Exceptional $117,912 |
| Bulgarians | 100.0 /100 | #43 | Exceptional $117,818 |
| Cambodians | 100.0 /100 | #44 | Exceptional $117,780 |
| Immigrants | Greece | 99.9 /100 | #45 | Exceptional $117,344 |
| Immigrants | Russia | 99.9 /100 | #46 | Exceptional $116,942 |