Arapaho vs Immigrants from Zaire Median Family Income
COMPARE
Arapaho
Immigrants from Zaire
Median Family Income
Median Family Income Comparison
Arapaho
Immigrants from Zaire
$82,064
MEDIAN FAMILY INCOME
0.0/ 100
METRIC RATING
327th/ 347
METRIC RANK
$89,285
MEDIAN FAMILY INCOME
0.1/ 100
METRIC RATING
276th/ 347
METRIC RANK
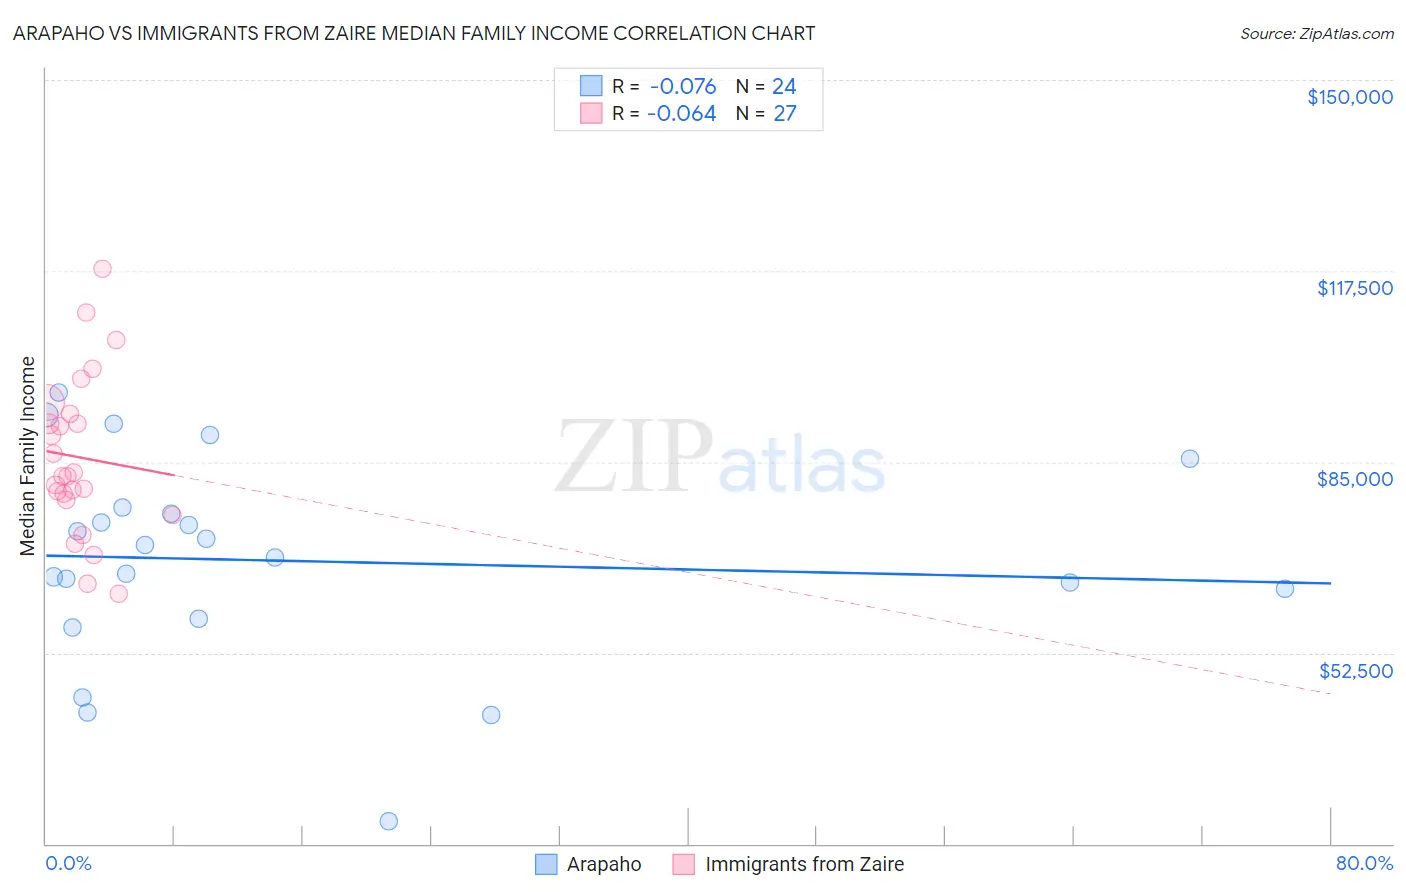
Arapaho vs Immigrants from Zaire Median Family Income Correlation Chart
The statistical analysis conducted on geographies consisting of 29,776,303 people shows a slight negative correlation between the proportion of Arapaho and median family income in the United States with a correlation coefficient (R) of -0.076 and weighted average of $82,064. Similarly, the statistical analysis conducted on geographies consisting of 107,241,539 people shows a slight negative correlation between the proportion of Immigrants from Zaire and median family income in the United States with a correlation coefficient (R) of -0.064 and weighted average of $89,285, a difference of 8.8%.
Median Family Income Correlation Summary
| Measurement | Arapaho | Immigrants from Zaire |
| Minimum | $23,750 | $62,631 |
| Maximum | $96,782 | $117,948 |
| Range | $73,032 | $55,317 |
| Mean | $68,152 | $85,792 |
| Median | $69,777 | $82,545 |
| Interquartile 25% (IQ1) | $60,858 | $78,573 |
| Interquartile 75% (IQ3) | $76,786 | $93,272 |
| Interquartile Range (IQR) | $15,928 | $14,699 |
| Standard Deviation (Sample) | $17,667 | $13,444 |
| Standard Deviation (Population) | $17,295 | $13,193 |
Similar Demographics by Median Family Income
Demographics Similar to Arapaho by Median Family Income
In terms of median family income, the demographic groups most similar to Arapaho are Black/African American ($81,912, a difference of 0.18%), Immigrants from Congo ($82,216, a difference of 0.19%), Dutch West Indian ($81,852, a difference of 0.26%), Sioux ($82,386, a difference of 0.39%), and Creek ($82,560, a difference of 0.61%).
| Demographics | Rating | Rank | Median Family Income |
| Seminole | 0.0 /100 | #320 | Tragic $83,354 |
| Immigrants | Caribbean | 0.0 /100 | #321 | Tragic $83,319 |
| Dominicans | 0.0 /100 | #322 | Tragic $82,888 |
| Bahamians | 0.0 /100 | #323 | Tragic $82,631 |
| Creek | 0.0 /100 | #324 | Tragic $82,560 |
| Sioux | 0.0 /100 | #325 | Tragic $82,386 |
| Immigrants | Congo | 0.0 /100 | #326 | Tragic $82,216 |
| Arapaho | 0.0 /100 | #327 | Tragic $82,064 |
| Blacks/African Americans | 0.0 /100 | #328 | Tragic $81,912 |
| Dutch West Indians | 0.0 /100 | #329 | Tragic $81,852 |
| Cheyenne | 0.0 /100 | #330 | Tragic $81,385 |
| Immigrants | Dominican Republic | 0.0 /100 | #331 | Tragic $81,233 |
| Natives/Alaskans | 0.0 /100 | #332 | Tragic $80,908 |
| Kiowa | 0.0 /100 | #333 | Tragic $80,885 |
| Menominee | 0.0 /100 | #334 | Tragic $79,563 |
Demographics Similar to Immigrants from Zaire by Median Family Income
In terms of median family income, the demographic groups most similar to Immigrants from Zaire are Immigrants from Jamaica ($89,268, a difference of 0.020%), Immigrants from Grenada ($89,249, a difference of 0.040%), Immigrants from Belize ($89,197, a difference of 0.10%), British West Indian ($88,987, a difference of 0.33%), and Blackfeet ($88,717, a difference of 0.64%).
| Demographics | Rating | Rank | Median Family Income |
| Belizeans | 0.2 /100 | #269 | Tragic $90,880 |
| Jamaicans | 0.2 /100 | #270 | Tragic $90,581 |
| Iroquois | 0.2 /100 | #271 | Tragic $90,543 |
| Immigrants | Liberia | 0.2 /100 | #272 | Tragic $90,450 |
| Immigrants | Micronesia | 0.2 /100 | #273 | Tragic $90,345 |
| Spanish Americans | 0.2 /100 | #274 | Tragic $90,322 |
| Immigrants | St. Vincent and the Grenadines | 0.2 /100 | #275 | Tragic $90,094 |
| Immigrants | Zaire | 0.1 /100 | #276 | Tragic $89,285 |
| Immigrants | Jamaica | 0.1 /100 | #277 | Tragic $89,268 |
| Immigrants | Grenada | 0.1 /100 | #278 | Tragic $89,249 |
| Immigrants | Belize | 0.1 /100 | #279 | Tragic $89,197 |
| British West Indians | 0.1 /100 | #280 | Tragic $88,987 |
| Blackfeet | 0.1 /100 | #281 | Tragic $88,717 |
| Comanche | 0.1 /100 | #282 | Tragic $88,556 |
| Bangladeshis | 0.1 /100 | #283 | Tragic $88,358 |