Arapaho vs Apache Median Family Income
COMPARE
Arapaho
Apache
Median Family Income
Median Family Income Comparison
Arapaho
Apache
$82,064
MEDIAN FAMILY INCOME
0.0/ 100
METRIC RATING
327th/ 347
METRIC RANK
$84,451
MEDIAN FAMILY INCOME
0.0/ 100
METRIC RATING
315th/ 347
METRIC RANK
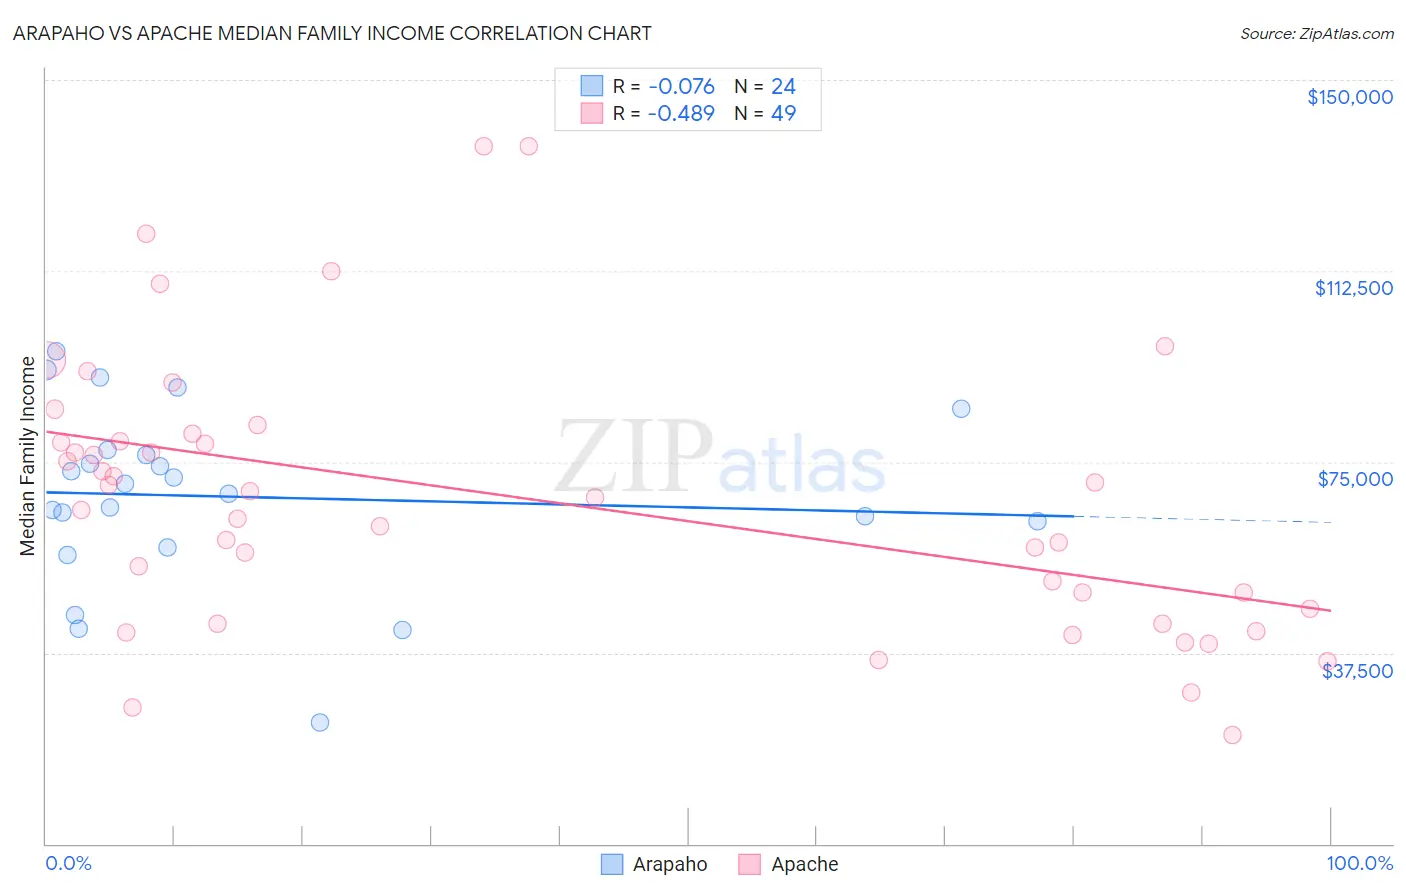
Arapaho vs Apache Median Family Income Correlation Chart
The statistical analysis conducted on geographies consisting of 29,776,303 people shows a slight negative correlation between the proportion of Arapaho and median family income in the United States with a correlation coefficient (R) of -0.076 and weighted average of $82,064. Similarly, the statistical analysis conducted on geographies consisting of 231,007,077 people shows a moderate negative correlation between the proportion of Apache and median family income in the United States with a correlation coefficient (R) of -0.489 and weighted average of $84,451, a difference of 2.9%.
Median Family Income Correlation Summary
| Measurement | Arapaho | Apache |
| Minimum | $23,750 | $21,444 |
| Maximum | $96,782 | $136,944 |
| Range | $73,032 | $115,500 |
| Mean | $68,152 | $67,810 |
| Median | $69,777 | $68,015 |
| Interquartile 25% (IQ1) | $60,858 | $44,680 |
| Interquartile 75% (IQ3) | $76,786 | $79,729 |
| Interquartile Range (IQR) | $15,928 | $35,049 |
| Standard Deviation (Sample) | $17,667 | $26,784 |
| Standard Deviation (Population) | $17,295 | $26,510 |
Demographics Similar to Arapaho and Apache by Median Family Income
In terms of median family income, the demographic groups most similar to Arapaho are Black/African American ($81,912, a difference of 0.18%), Immigrants from Congo ($82,216, a difference of 0.19%), Dutch West Indian ($81,852, a difference of 0.26%), Sioux ($82,386, a difference of 0.39%), and Creek ($82,560, a difference of 0.61%). Similarly, the demographic groups most similar to Apache are Immigrants from Bahamas ($84,732, a difference of 0.33%), Choctaw ($84,835, a difference of 0.45%), Immigrants from Haiti ($84,018, a difference of 0.52%), Yakama ($83,932, a difference of 0.62%), and Cuban ($84,981, a difference of 0.63%).
| Demographics | Rating | Rank | Median Family Income |
| Hondurans | 0.0 /100 | #311 | Tragic $85,004 |
| Cubans | 0.0 /100 | #312 | Tragic $84,981 |
| Choctaw | 0.0 /100 | #313 | Tragic $84,835 |
| Immigrants | Bahamas | 0.0 /100 | #314 | Tragic $84,732 |
| Apache | 0.0 /100 | #315 | Tragic $84,451 |
| Immigrants | Haiti | 0.0 /100 | #316 | Tragic $84,018 |
| Yakama | 0.0 /100 | #317 | Tragic $83,932 |
| Immigrants | Mexico | 0.0 /100 | #318 | Tragic $83,639 |
| Immigrants | Honduras | 0.0 /100 | #319 | Tragic $83,618 |
| Seminole | 0.0 /100 | #320 | Tragic $83,354 |
| Immigrants | Caribbean | 0.0 /100 | #321 | Tragic $83,319 |
| Dominicans | 0.0 /100 | #322 | Tragic $82,888 |
| Bahamians | 0.0 /100 | #323 | Tragic $82,631 |
| Creek | 0.0 /100 | #324 | Tragic $82,560 |
| Sioux | 0.0 /100 | #325 | Tragic $82,386 |
| Immigrants | Congo | 0.0 /100 | #326 | Tragic $82,216 |
| Arapaho | 0.0 /100 | #327 | Tragic $82,064 |
| Blacks/African Americans | 0.0 /100 | #328 | Tragic $81,912 |
| Dutch West Indians | 0.0 /100 | #329 | Tragic $81,852 |
| Cheyenne | 0.0 /100 | #330 | Tragic $81,385 |
| Immigrants | Dominican Republic | 0.0 /100 | #331 | Tragic $81,233 |