Arapaho vs Immigrants from Middle Africa Female Poverty Among 18-24 Year Olds
COMPARE
Arapaho
Immigrants from Middle Africa
Female Poverty Among 18-24 Year Olds
Female Poverty Among 18-24 Year Olds Comparison
Arapaho
Immigrants from Middle Africa
25.2%
FEMALE POVERTY AMONG 18-24 YEAR OLDS
0.0/ 100
METRIC RATING
323rd/ 347
METRIC RANK
22.1%
FEMALE POVERTY AMONG 18-24 YEAR OLDS
0.0/ 100
METRIC RATING
287th/ 347
METRIC RANK
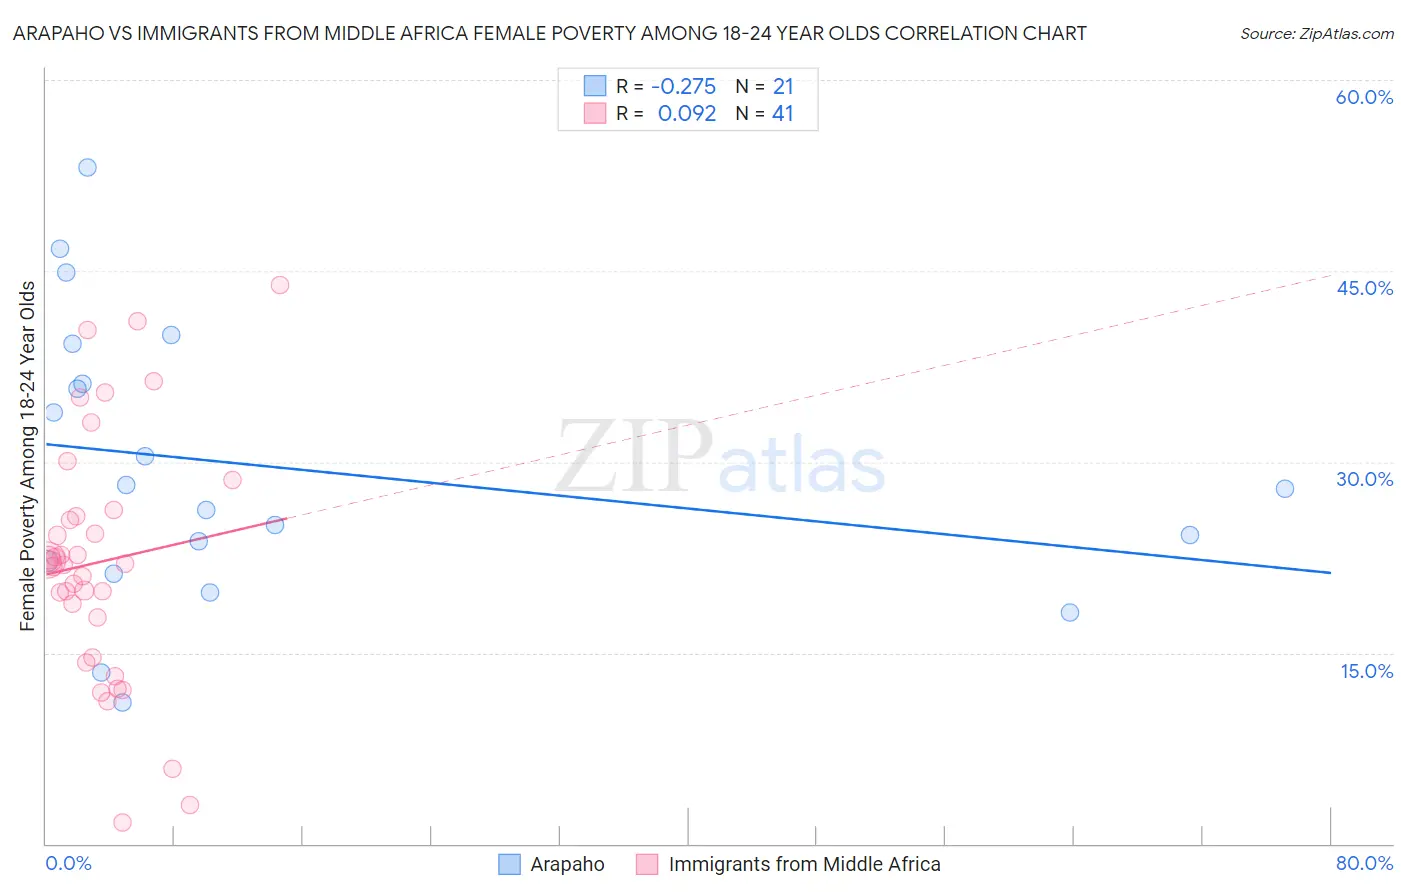
Arapaho vs Immigrants from Middle Africa Female Poverty Among 18-24 Year Olds Correlation Chart
The statistical analysis conducted on geographies consisting of 29,593,135 people shows a weak negative correlation between the proportion of Arapaho and poverty level among females between the ages 18 and 24 in the United States with a correlation coefficient (R) of -0.275 and weighted average of 25.2%. Similarly, the statistical analysis conducted on geographies consisting of 200,899,042 people shows a slight positive correlation between the proportion of Immigrants from Middle Africa and poverty level among females between the ages 18 and 24 in the United States with a correlation coefficient (R) of 0.092 and weighted average of 22.1%, a difference of 14.0%.
Female Poverty Among 18-24 Year Olds Correlation Summary
| Measurement | Arapaho | Immigrants from Middle Africa |
| Minimum | 11.1% | 1.6% |
| Maximum | 53.1% | 43.9% |
| Range | 42.0% | 42.3% |
| Mean | 29.6% | 22.1% |
| Median | 27.8% | 22.0% |
| Interquartile 25% (IQ1) | 21.7% | 16.2% |
| Interquartile 75% (IQ3) | 37.7% | 26.0% |
| Interquartile Range (IQR) | 16.0% | 9.8% |
| Standard Deviation (Sample) | 11.0% | 9.6% |
| Standard Deviation (Population) | 10.8% | 9.5% |
Similar Demographics by Female Poverty Among 18-24 Year Olds
Demographics Similar to Arapaho by Female Poverty Among 18-24 Year Olds
In terms of female poverty among 18-24 year olds, the demographic groups most similar to Arapaho are German Russian (25.2%, a difference of 0.030%), Somali (25.1%, a difference of 0.070%), Immigrants from Zaire (25.1%, a difference of 0.37%), Immigrants from Saudi Arabia (25.3%, a difference of 0.46%), and Yakama (25.3%, a difference of 0.71%).
| Demographics | Rating | Rank | Female Poverty Among 18-24 Year Olds |
| Alsatians | 0.0 /100 | #316 | Tragic 24.4% |
| Osage | 0.0 /100 | #317 | Tragic 24.5% |
| Chickasaw | 0.0 /100 | #318 | Tragic 24.5% |
| Dutch West Indians | 0.0 /100 | #319 | Tragic 24.5% |
| Immigrants | Congo | 0.0 /100 | #320 | Tragic 24.6% |
| Immigrants | Zaire | 0.0 /100 | #321 | Tragic 25.1% |
| Somalis | 0.0 /100 | #322 | Tragic 25.1% |
| Arapaho | 0.0 /100 | #323 | Tragic 25.2% |
| German Russians | 0.0 /100 | #324 | Tragic 25.2% |
| Immigrants | Saudi Arabia | 0.0 /100 | #325 | Tragic 25.3% |
| Yakama | 0.0 /100 | #326 | Tragic 25.3% |
| Ute | 0.0 /100 | #327 | Tragic 25.4% |
| Natives/Alaskans | 0.0 /100 | #328 | Tragic 25.4% |
| Cajuns | 0.0 /100 | #329 | Tragic 25.7% |
| Immigrants | Somalia | 0.0 /100 | #330 | Tragic 25.7% |
Demographics Similar to Immigrants from Middle Africa by Female Poverty Among 18-24 Year Olds
In terms of female poverty among 18-24 year olds, the demographic groups most similar to Immigrants from Middle Africa are Ugandan (22.1%, a difference of 0.010%), Ottawa (22.0%, a difference of 0.20%), Tlingit-Haida (22.0%, a difference of 0.32%), Subsaharan African (22.0%, a difference of 0.33%), and Bermudan (21.9%, a difference of 0.63%).
| Demographics | Rating | Rank | Female Poverty Among 18-24 Year Olds |
| Immigrants | Dominica | 0.1 /100 | #280 | Tragic 21.9% |
| Immigrants | Dominican Republic | 0.1 /100 | #281 | Tragic 21.9% |
| Bermudans | 0.1 /100 | #282 | Tragic 21.9% |
| Sub-Saharan Africans | 0.0 /100 | #283 | Tragic 22.0% |
| Tlingit-Haida | 0.0 /100 | #284 | Tragic 22.0% |
| Ottawa | 0.0 /100 | #285 | Tragic 22.0% |
| Ugandans | 0.0 /100 | #286 | Tragic 22.1% |
| Immigrants | Middle Africa | 0.0 /100 | #287 | Tragic 22.1% |
| Dominicans | 0.0 /100 | #288 | Tragic 22.3% |
| French American Indians | 0.0 /100 | #289 | Tragic 22.3% |
| Immigrants | Senegal | 0.0 /100 | #290 | Tragic 22.4% |
| Bangladeshis | 0.0 /100 | #291 | Tragic 22.5% |
| Alaskan Athabascans | 0.0 /100 | #292 | Tragic 22.5% |
| U.S. Virgin Islanders | 0.0 /100 | #293 | Tragic 22.5% |
| Indonesians | 0.0 /100 | #294 | Tragic 22.5% |