Arapaho vs Egyptian Median Family Income
COMPARE
Arapaho
Egyptian
Median Family Income
Median Family Income Comparison
Arapaho
Egyptians
$82,064
MEDIAN FAMILY INCOME
0.0/ 100
METRIC RATING
327th/ 347
METRIC RANK
$114,119
MEDIAN FAMILY INCOME
99.7/ 100
METRIC RATING
65th/ 347
METRIC RANK
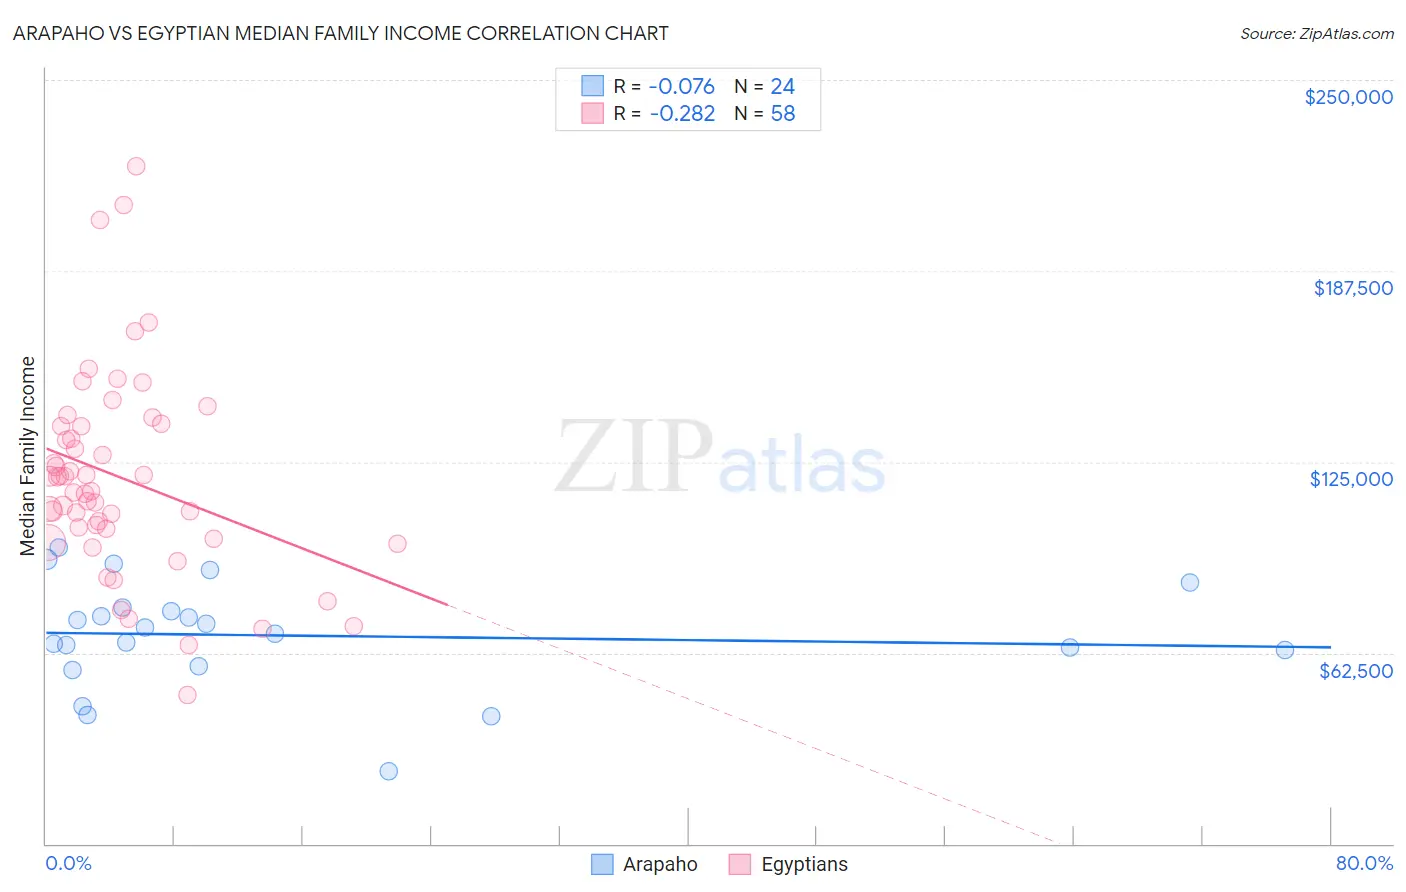
Arapaho vs Egyptian Median Family Income Correlation Chart
The statistical analysis conducted on geographies consisting of 29,776,303 people shows a slight negative correlation between the proportion of Arapaho and median family income in the United States with a correlation coefficient (R) of -0.076 and weighted average of $82,064. Similarly, the statistical analysis conducted on geographies consisting of 276,687,434 people shows a weak negative correlation between the proportion of Egyptians and median family income in the United States with a correlation coefficient (R) of -0.282 and weighted average of $114,119, a difference of 39.1%.
Median Family Income Correlation Summary
| Measurement | Arapaho | Egyptian |
| Minimum | $23,750 | $48,661 |
| Maximum | $96,782 | $221,912 |
| Range | $73,032 | $173,251 |
| Mean | $68,152 | $119,991 |
| Median | $69,777 | $117,654 |
| Interquartile 25% (IQ1) | $60,858 | $103,125 |
| Interquartile 75% (IQ3) | $76,786 | $136,794 |
| Interquartile Range (IQR) | $15,928 | $33,669 |
| Standard Deviation (Sample) | $17,667 | $33,329 |
| Standard Deviation (Population) | $17,295 | $33,040 |
Similar Demographics by Median Family Income
Demographics Similar to Arapaho by Median Family Income
In terms of median family income, the demographic groups most similar to Arapaho are Black/African American ($81,912, a difference of 0.18%), Immigrants from Congo ($82,216, a difference of 0.19%), Dutch West Indian ($81,852, a difference of 0.26%), Sioux ($82,386, a difference of 0.39%), and Creek ($82,560, a difference of 0.61%).
| Demographics | Rating | Rank | Median Family Income |
| Seminole | 0.0 /100 | #320 | Tragic $83,354 |
| Immigrants | Caribbean | 0.0 /100 | #321 | Tragic $83,319 |
| Dominicans | 0.0 /100 | #322 | Tragic $82,888 |
| Bahamians | 0.0 /100 | #323 | Tragic $82,631 |
| Creek | 0.0 /100 | #324 | Tragic $82,560 |
| Sioux | 0.0 /100 | #325 | Tragic $82,386 |
| Immigrants | Congo | 0.0 /100 | #326 | Tragic $82,216 |
| Arapaho | 0.0 /100 | #327 | Tragic $82,064 |
| Blacks/African Americans | 0.0 /100 | #328 | Tragic $81,912 |
| Dutch West Indians | 0.0 /100 | #329 | Tragic $81,852 |
| Cheyenne | 0.0 /100 | #330 | Tragic $81,385 |
| Immigrants | Dominican Republic | 0.0 /100 | #331 | Tragic $81,233 |
| Natives/Alaskans | 0.0 /100 | #332 | Tragic $80,908 |
| Kiowa | 0.0 /100 | #333 | Tragic $80,885 |
| Menominee | 0.0 /100 | #334 | Tragic $79,563 |
Demographics Similar to Egyptians by Median Family Income
In terms of median family income, the demographic groups most similar to Egyptians are Paraguayan ($114,016, a difference of 0.090%), Immigrants from Scotland ($114,392, a difference of 0.24%), Immigrants from Pakistan ($114,406, a difference of 0.25%), Immigrants from Spain ($113,815, a difference of 0.27%), and Mongolian ($114,553, a difference of 0.38%).
| Demographics | Rating | Rank | Median Family Income |
| Immigrants | Indonesia | 99.8 /100 | #58 | Exceptional $115,162 |
| Immigrants | Netherlands | 99.8 /100 | #59 | Exceptional $114,987 |
| Immigrants | Latvia | 99.8 /100 | #60 | Exceptional $114,826 |
| Immigrants | Belarus | 99.8 /100 | #61 | Exceptional $114,586 |
| Mongolians | 99.8 /100 | #62 | Exceptional $114,553 |
| Immigrants | Pakistan | 99.8 /100 | #63 | Exceptional $114,406 |
| Immigrants | Scotland | 99.7 /100 | #64 | Exceptional $114,392 |
| Egyptians | 99.7 /100 | #65 | Exceptional $114,119 |
| Paraguayans | 99.7 /100 | #66 | Exceptional $114,016 |
| Immigrants | Spain | 99.7 /100 | #67 | Exceptional $113,815 |
| Immigrants | Serbia | 99.6 /100 | #68 | Exceptional $113,463 |
| Immigrants | Bulgaria | 99.6 /100 | #69 | Exceptional $113,461 |
| Immigrants | Romania | 99.6 /100 | #70 | Exceptional $113,434 |
| South Africans | 99.5 /100 | #71 | Exceptional $113,229 |
| Afghans | 99.5 /100 | #72 | Exceptional $112,971 |