Arapaho vs Immigrants from Middle Africa Associate's Degree
COMPARE
Arapaho
Immigrants from Middle Africa
Associate's Degree
Associate's Degree Comparison
Arapaho
Immigrants from Middle Africa
36.7%
ASSOCIATE'S DEGREE
0.0/ 100
METRIC RATING
324th/ 347
METRIC RANK
44.7%
ASSOCIATE'S DEGREE
12.7/ 100
METRIC RATING
214th/ 347
METRIC RANK
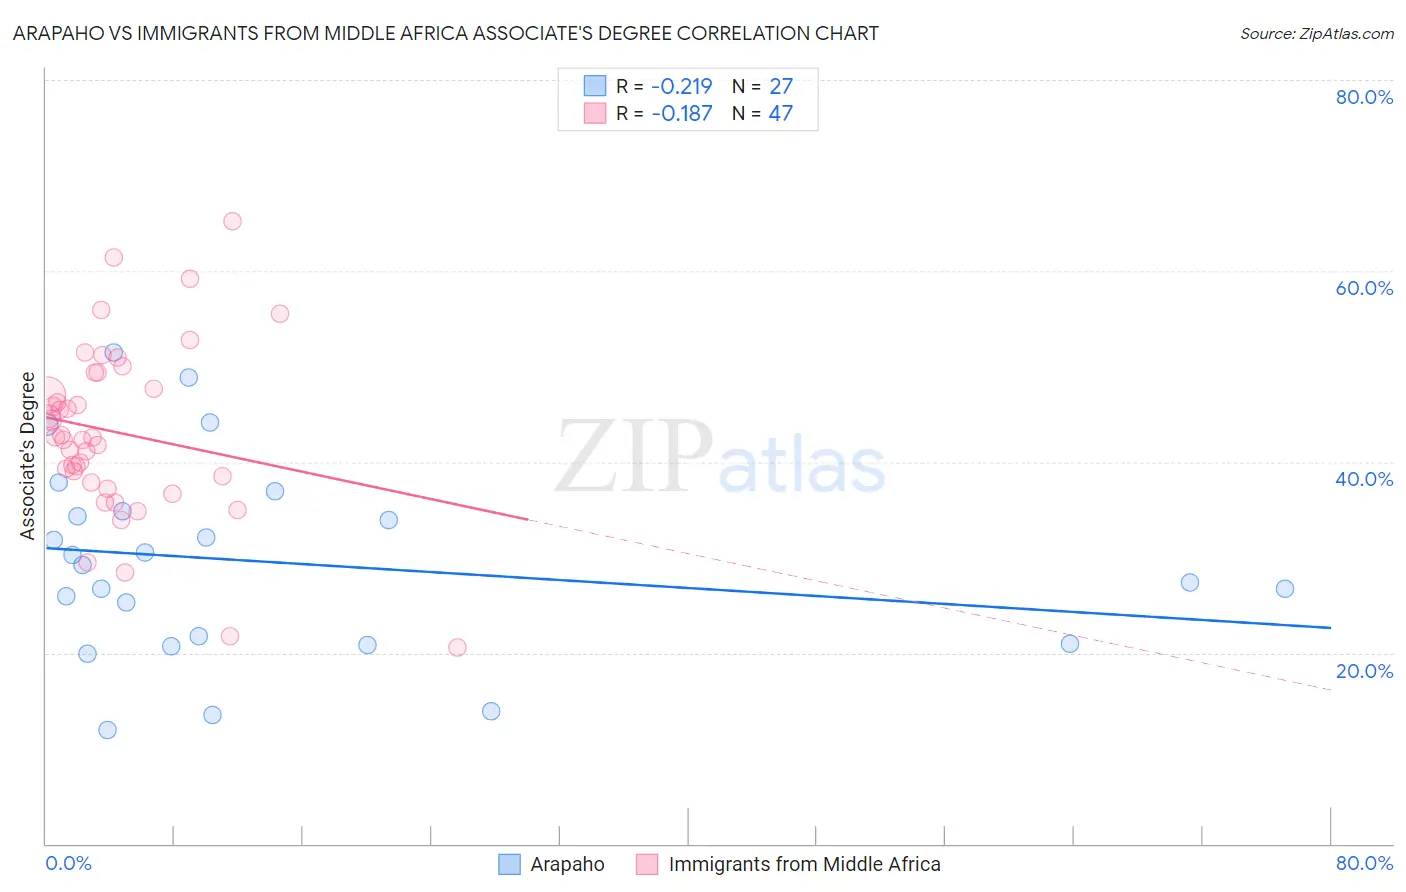
Arapaho vs Immigrants from Middle Africa Associate's Degree Correlation Chart
The statistical analysis conducted on geographies consisting of 29,779,330 people shows a weak negative correlation between the proportion of Arapaho and percentage of population with at least associate's degree education in the United States with a correlation coefficient (R) of -0.219 and weighted average of 36.7%. Similarly, the statistical analysis conducted on geographies consisting of 202,743,953 people shows a poor negative correlation between the proportion of Immigrants from Middle Africa and percentage of population with at least associate's degree education in the United States with a correlation coefficient (R) of -0.187 and weighted average of 44.7%, a difference of 21.7%.
Associate's Degree Correlation Summary
| Measurement | Arapaho | Immigrants from Middle Africa |
| Minimum | 11.9% | 20.5% |
| Maximum | 51.5% | 65.2% |
| Range | 39.6% | 44.7% |
| Mean | 29.5% | 43.1% |
| Median | 29.2% | 42.6% |
| Interquartile 25% (IQ1) | 21.0% | 37.8% |
| Interquartile 75% (IQ3) | 34.8% | 49.3% |
| Interquartile Range (IQR) | 13.8% | 11.5% |
| Standard Deviation (Sample) | 10.2% | 9.1% |
| Standard Deviation (Population) | 10.0% | 9.0% |
Similar Demographics by Associate's Degree
Demographics Similar to Arapaho by Associate's Degree
In terms of associate's degree, the demographic groups most similar to Arapaho are Menominee (36.7%, a difference of 0.11%), Immigrants from Cabo Verde (36.8%, a difference of 0.16%), Kiowa (36.5%, a difference of 0.67%), Dutch West Indian (36.5%, a difference of 0.69%), and Alaskan Athabascan (36.5%, a difference of 0.70%).
| Demographics | Rating | Rank | Associate's Degree |
| Yaqui | 0.0 /100 | #317 | Tragic 37.6% |
| Alaska Natives | 0.0 /100 | #318 | Tragic 37.5% |
| Fijians | 0.0 /100 | #319 | Tragic 37.4% |
| Cajuns | 0.0 /100 | #320 | Tragic 37.4% |
| Immigrants | Yemen | 0.0 /100 | #321 | Tragic 37.3% |
| Pennsylvania Germans | 0.0 /100 | #322 | Tragic 37.2% |
| Immigrants | Cabo Verde | 0.0 /100 | #323 | Tragic 36.8% |
| Arapaho | 0.0 /100 | #324 | Tragic 36.7% |
| Menominee | 0.0 /100 | #325 | Tragic 36.7% |
| Kiowa | 0.0 /100 | #326 | Tragic 36.5% |
| Dutch West Indians | 0.0 /100 | #327 | Tragic 36.5% |
| Alaskan Athabascans | 0.0 /100 | #328 | Tragic 36.5% |
| Paiute | 0.0 /100 | #329 | Tragic 36.4% |
| Apache | 0.0 /100 | #330 | Tragic 36.2% |
| Immigrants | Azores | 0.0 /100 | #331 | Tragic 35.6% |
Demographics Similar to Immigrants from Middle Africa by Associate's Degree
In terms of associate's degree, the demographic groups most similar to Immigrants from Middle Africa are Immigrants from Panama (44.7%, a difference of 0.060%), Immigrants from Nigeria (44.6%, a difference of 0.24%), Immigrants from Ghana (44.8%, a difference of 0.25%), French Canadian (44.9%, a difference of 0.38%), and Immigrants (44.5%, a difference of 0.42%).
| Demographics | Rating | Rank | Associate's Degree |
| Panamanians | 18.4 /100 | #207 | Poor 45.1% |
| Dutch | 17.6 /100 | #208 | Poor 45.0% |
| Immigrants | Costa Rica | 16.7 /100 | #209 | Poor 45.0% |
| Immigrants | Philippines | 16.7 /100 | #210 | Poor 45.0% |
| Immigrants | Zaire | 16.6 /100 | #211 | Poor 45.0% |
| French Canadians | 15.0 /100 | #212 | Poor 44.9% |
| Immigrants | Ghana | 14.2 /100 | #213 | Poor 44.8% |
| Immigrants | Middle Africa | 12.7 /100 | #214 | Poor 44.7% |
| Immigrants | Panama | 12.4 /100 | #215 | Poor 44.7% |
| Immigrants | Nigeria | 11.4 /100 | #216 | Poor 44.6% |
| Immigrants | Immigrants | 10.5 /100 | #217 | Poor 44.5% |
| Spanish | 9.4 /100 | #218 | Tragic 44.4% |
| Whites/Caucasians | 7.5 /100 | #219 | Tragic 44.2% |
| Portuguese | 7.2 /100 | #220 | Tragic 44.1% |
| Immigrants | Western Africa | 6.6 /100 | #221 | Tragic 44.1% |