Apache vs Immigrants from Portugal 12th Grade, No Diploma
COMPARE
Apache
Immigrants from Portugal
12th Grade, No Diploma
12th Grade, No Diploma Comparison
Apache
Immigrants from Portugal
87.3%
12TH GRADE, NO DIPLOMA
0.0/ 100
METRIC RATING
316th/ 347
METRIC RANK
87.6%
12TH GRADE, NO DIPLOMA
0.0/ 100
METRIC RATING
307th/ 347
METRIC RANK
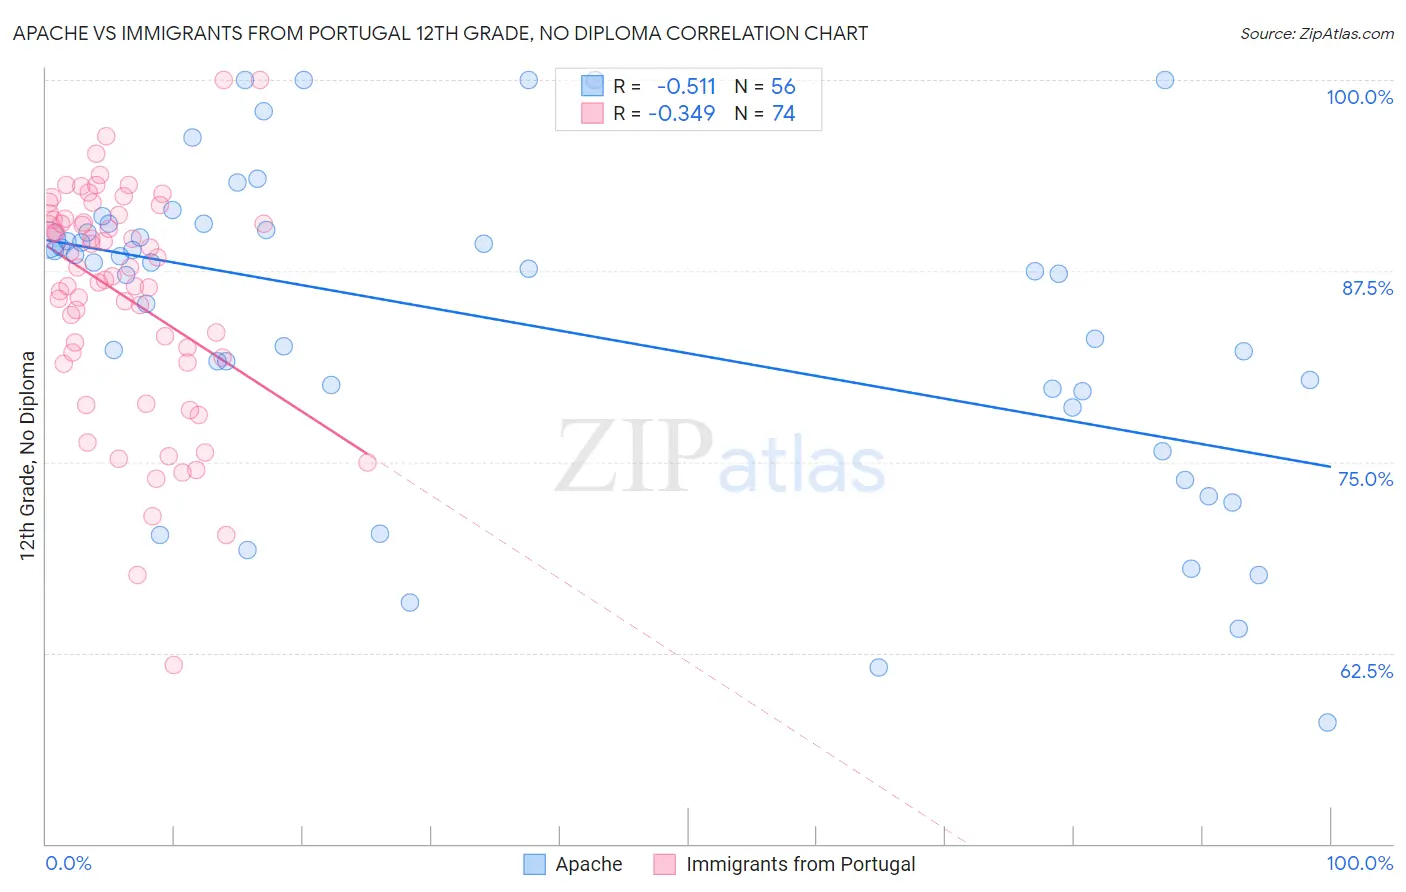
Apache vs Immigrants from Portugal 12th Grade, No Diploma Correlation Chart
The statistical analysis conducted on geographies consisting of 231,143,094 people shows a substantial negative correlation between the proportion of Apache and percentage of population with at least 12th grade (no diploma) education in the United States with a correlation coefficient (R) of -0.511 and weighted average of 87.3%. Similarly, the statistical analysis conducted on geographies consisting of 174,792,669 people shows a mild negative correlation between the proportion of Immigrants from Portugal and percentage of population with at least 12th grade (no diploma) education in the United States with a correlation coefficient (R) of -0.349 and weighted average of 87.6%, a difference of 0.34%.
12th Grade, No Diploma Correlation Summary
| Measurement | Apache | Immigrants from Portugal |
| Minimum | 58.0% | 61.7% |
| Maximum | 100.0% | 100.0% |
| Range | 42.0% | 38.3% |
| Mean | 84.1% | 85.8% |
| Median | 87.6% | 87.4% |
| Interquartile 25% (IQ1) | 79.1% | 81.8% |
| Interquartile 75% (IQ3) | 90.1% | 90.9% |
| Interquartile Range (IQR) | 11.0% | 9.1% |
| Standard Deviation (Sample) | 10.4% | 7.5% |
| Standard Deviation (Population) | 10.4% | 7.5% |
Demographics Similar to Apache and Immigrants from Portugal by 12th Grade, No Diploma
In terms of 12th grade, no diploma, the demographic groups most similar to Apache are Nicaraguan (87.3%, a difference of 0.010%), Cape Verdean (87.4%, a difference of 0.050%), Immigrants from Caribbean (87.4%, a difference of 0.070%), Immigrants from Ecuador (87.5%, a difference of 0.18%), and Yaqui (87.5%, a difference of 0.19%). Similarly, the demographic groups most similar to Immigrants from Portugal are Native/Alaskan (87.7%, a difference of 0.040%), Yup'ik (87.6%, a difference of 0.040%), Immigrants from Armenia (87.6%, a difference of 0.070%), Immigrants from Dominica (87.7%, a difference of 0.11%), and Immigrants from Cuba (87.5%, a difference of 0.12%).
| Demographics | Rating | Rank | 12th Grade, No Diploma |
| Immigrants | Cambodia | 0.0 /100 | #301 | Tragic 88.1% |
| Ecuadorians | 0.0 /100 | #302 | Tragic 88.0% |
| Immigrants | Bangladesh | 0.0 /100 | #303 | Tragic 88.0% |
| Vietnamese | 0.0 /100 | #304 | Tragic 87.9% |
| Immigrants | Dominica | 0.0 /100 | #305 | Tragic 87.7% |
| Natives/Alaskans | 0.0 /100 | #306 | Tragic 87.7% |
| Immigrants | Portugal | 0.0 /100 | #307 | Tragic 87.6% |
| Yup'ik | 0.0 /100 | #308 | Tragic 87.6% |
| Immigrants | Armenia | 0.0 /100 | #309 | Tragic 87.6% |
| Immigrants | Cuba | 0.0 /100 | #310 | Tragic 87.5% |
| Yaqui | 0.0 /100 | #311 | Tragic 87.5% |
| Immigrants | Ecuador | 0.0 /100 | #312 | Tragic 87.5% |
| Immigrants | Caribbean | 0.0 /100 | #313 | Tragic 87.4% |
| Cape Verdeans | 0.0 /100 | #314 | Tragic 87.4% |
| Nicaraguans | 0.0 /100 | #315 | Tragic 87.3% |
| Apache | 0.0 /100 | #316 | Tragic 87.3% |
| Navajo | 0.0 /100 | #317 | Tragic 87.1% |
| Belizeans | 0.0 /100 | #318 | Tragic 87.0% |
| Immigrants | Belize | 0.0 /100 | #319 | Tragic 87.0% |
| Immigrants | Nicaragua | 0.0 /100 | #320 | Tragic 86.6% |
| Puerto Ricans | 0.0 /100 | #321 | Tragic 86.5% |