Apache vs Immigrants from Portugal Kindergarten
COMPARE
Apache
Immigrants from Portugal
Kindergarten
Kindergarten Comparison
Apache
Immigrants from Portugal
98.0%
KINDERGARTEN
75.0/ 100
METRIC RATING
148th/ 347
METRIC RANK
97.3%
KINDERGARTEN
0.0/ 100
METRIC RATING
285th/ 347
METRIC RANK
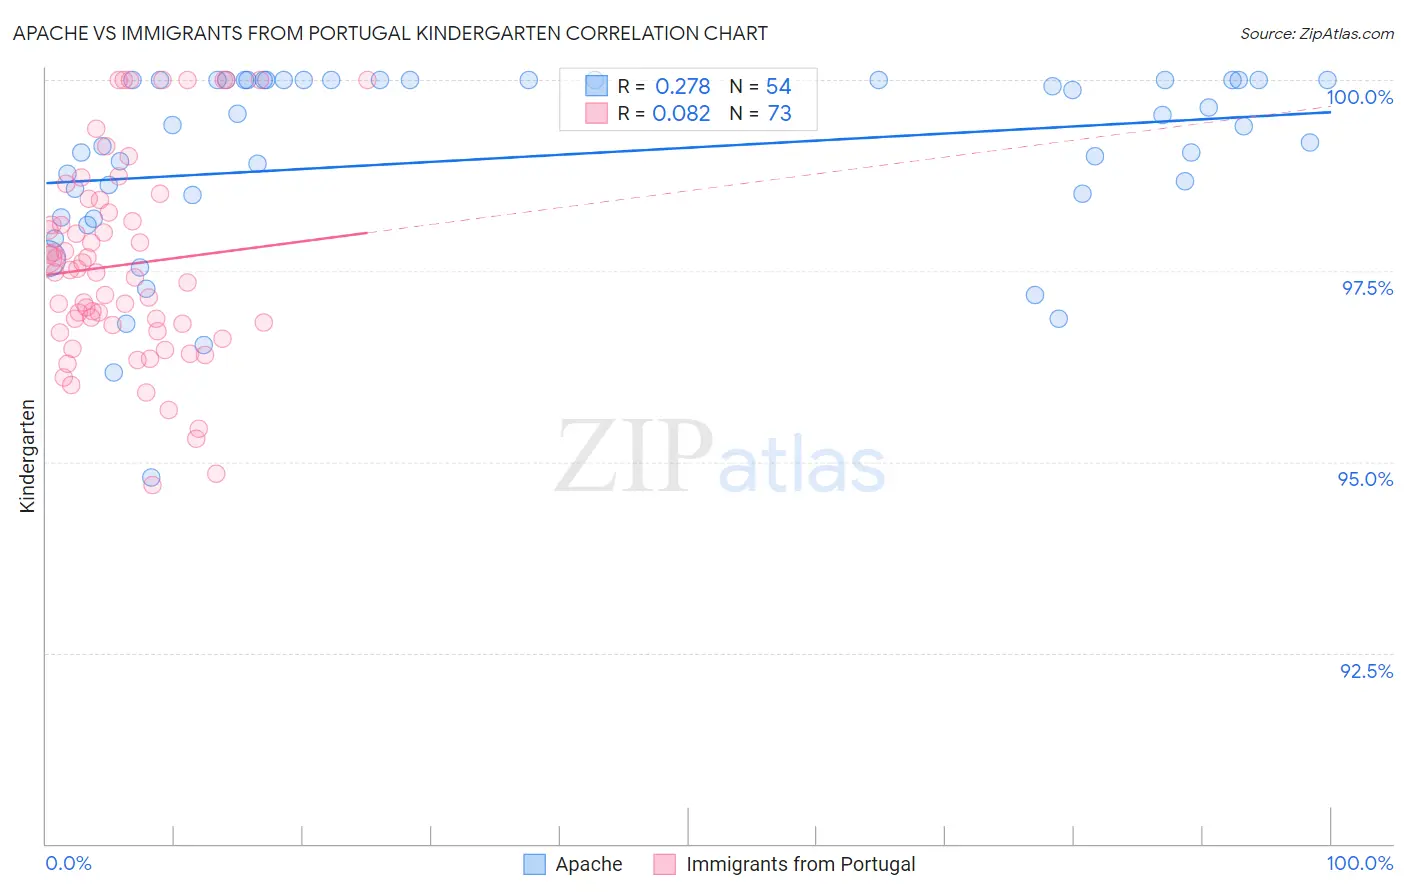
Apache vs Immigrants from Portugal Kindergarten Correlation Chart
The statistical analysis conducted on geographies consisting of 231,142,814 people shows a weak positive correlation between the proportion of Apache and percentage of population with at least kindergarten education in the United States with a correlation coefficient (R) of 0.278 and weighted average of 98.0%. Similarly, the statistical analysis conducted on geographies consisting of 174,792,107 people shows a slight positive correlation between the proportion of Immigrants from Portugal and percentage of population with at least kindergarten education in the United States with a correlation coefficient (R) of 0.082 and weighted average of 97.3%, a difference of 0.72%.
Kindergarten Correlation Summary
| Measurement | Apache | Immigrants from Portugal |
| Minimum | 94.8% | 94.7% |
| Maximum | 100.0% | 100.0% |
| Range | 5.2% | 5.3% |
| Mean | 99.0% | 97.6% |
| Median | 99.4% | 97.5% |
| Interquartile 25% (IQ1) | 98.5% | 96.8% |
| Interquartile 75% (IQ3) | 100.0% | 98.3% |
| Interquartile Range (IQR) | 1.5% | 1.6% |
| Standard Deviation (Sample) | 1.2% | 1.3% |
| Standard Deviation (Population) | 1.2% | 1.3% |
Similar Demographics by Kindergarten
Demographics Similar to Apache by Kindergarten
In terms of kindergarten, the demographic groups most similar to Apache are Immigrants from Greece (98.0%, a difference of 0.0%), Filipino (98.0%, a difference of 0.010%), Immigrants from Israel (98.0%, a difference of 0.010%), Jordanian (98.0%, a difference of 0.010%), and Alsatian (98.1%, a difference of 0.020%).
| Demographics | Rating | Rank | Kindergarten |
| Marshallese | 83.0 /100 | #141 | Excellent 98.1% |
| Immigrants | Turkey | 82.8 /100 | #142 | Excellent 98.1% |
| Burmese | 81.5 /100 | #143 | Excellent 98.1% |
| Alsatians | 80.4 /100 | #144 | Excellent 98.1% |
| Hmong | 78.8 /100 | #145 | Good 98.1% |
| Filipinos | 78.3 /100 | #146 | Good 98.0% |
| Immigrants | Israel | 77.6 /100 | #147 | Good 98.0% |
| Apache | 75.0 /100 | #148 | Good 98.0% |
| Immigrants | Greece | 74.9 /100 | #149 | Good 98.0% |
| Jordanians | 72.8 /100 | #150 | Good 98.0% |
| Soviet Union | 70.8 /100 | #151 | Good 98.0% |
| Dutch West Indians | 70.1 /100 | #152 | Good 98.0% |
| Immigrants | Moldova | 69.1 /100 | #153 | Good 98.0% |
| Immigrants | Iran | 68.8 /100 | #154 | Good 98.0% |
| Comanche | 68.3 /100 | #155 | Good 98.0% |
Demographics Similar to Immigrants from Portugal by Kindergarten
In terms of kindergarten, the demographic groups most similar to Immigrants from Portugal are Immigrants from Trinidad and Tobago (97.3%, a difference of 0.010%), Immigrants from Barbados (97.3%, a difference of 0.010%), Immigrants from Hong Kong (97.3%, a difference of 0.010%), Immigrants from West Indies (97.3%, a difference of 0.020%), and Immigrants from Thailand (97.3%, a difference of 0.020%).
| Demographics | Rating | Rank | Kindergarten |
| Immigrants | Uzbekistan | 0.1 /100 | #278 | Tragic 97.4% |
| Immigrants | Ghana | 0.1 /100 | #279 | Tragic 97.4% |
| Barbadians | 0.1 /100 | #280 | Tragic 97.4% |
| Trinidadians and Tobagonians | 0.1 /100 | #281 | Tragic 97.4% |
| Afghans | 0.0 /100 | #282 | Tragic 97.4% |
| Immigrants | West Indies | 0.0 /100 | #283 | Tragic 97.3% |
| Immigrants | Trinidad and Tobago | 0.0 /100 | #284 | Tragic 97.3% |
| Immigrants | Portugal | 0.0 /100 | #285 | Tragic 97.3% |
| Immigrants | Barbados | 0.0 /100 | #286 | Tragic 97.3% |
| Immigrants | Hong Kong | 0.0 /100 | #287 | Tragic 97.3% |
| Immigrants | Thailand | 0.0 /100 | #288 | Tragic 97.3% |
| Immigrants | Afghanistan | 0.0 /100 | #289 | Tragic 97.3% |
| Immigrants | St. Vincent and the Grenadines | 0.0 /100 | #290 | Tragic 97.3% |
| Houma | 0.0 /100 | #291 | Tragic 97.3% |
| British West Indians | 0.0 /100 | #292 | Tragic 97.3% |