Danish vs Immigrants from Laos Median Female Earnings
COMPARE
Danish
Immigrants from Laos
Median Female Earnings
Median Female Earnings Comparison
Danes
Immigrants from Laos
$37,730
MEDIAN FEMALE EARNINGS
1.6/ 100
METRIC RATING
253rd/ 347
METRIC RANK
$36,841
MEDIAN FEMALE EARNINGS
0.3/ 100
METRIC RATING
273rd/ 347
METRIC RANK
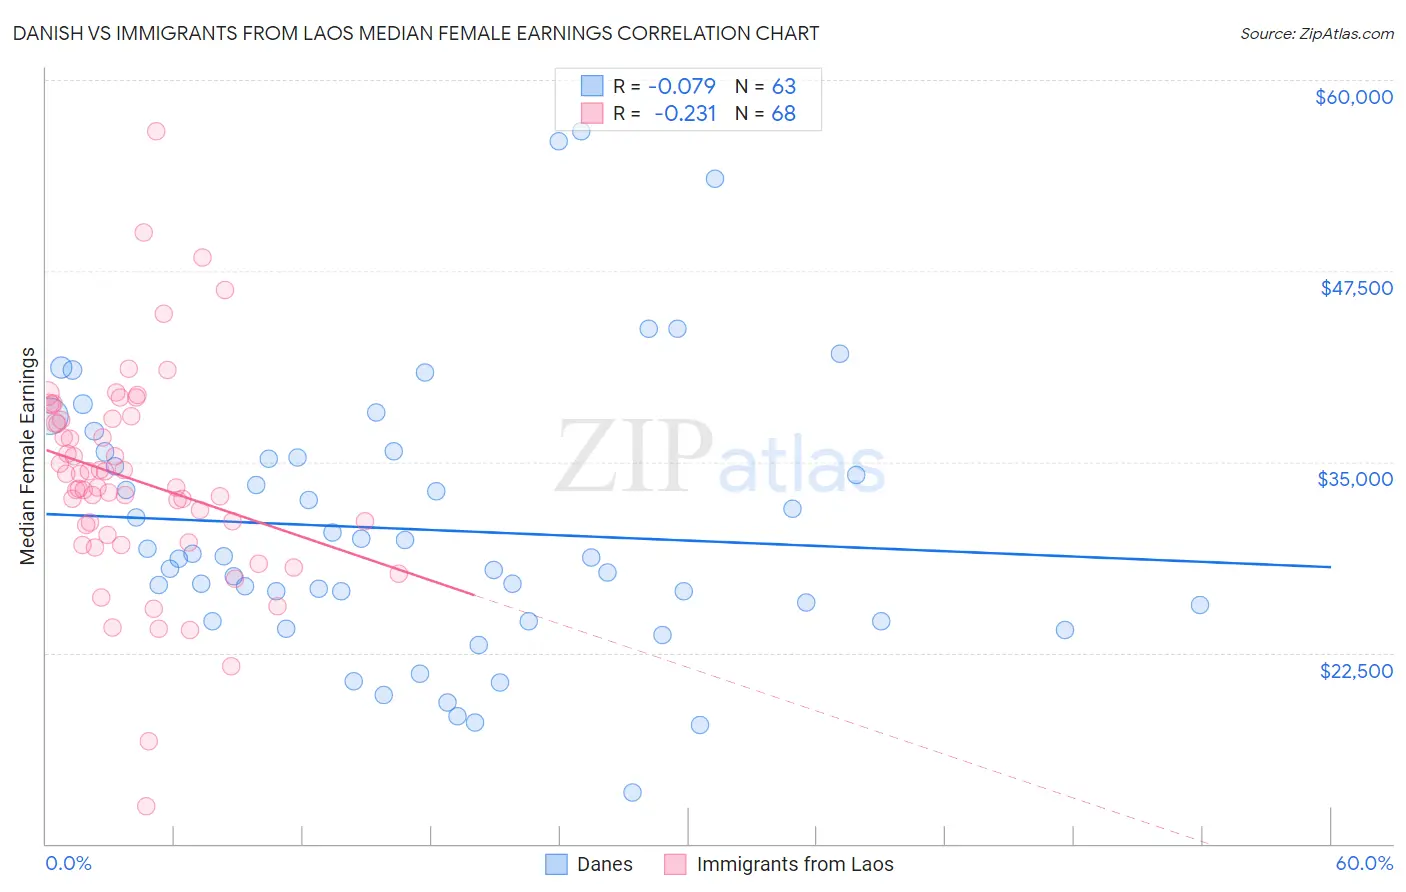
Danish vs Immigrants from Laos Median Female Earnings Correlation Chart
The statistical analysis conducted on geographies consisting of 473,573,147 people shows a slight negative correlation between the proportion of Danes and median female earnings in the United States with a correlation coefficient (R) of -0.079 and weighted average of $37,730. Similarly, the statistical analysis conducted on geographies consisting of 201,447,053 people shows a weak negative correlation between the proportion of Immigrants from Laos and median female earnings in the United States with a correlation coefficient (R) of -0.231 and weighted average of $36,841, a difference of 2.4%.
Median Female Earnings Correlation Summary
| Measurement | Danish | Immigrants from Laos |
| Minimum | $13,388 | $12,451 |
| Maximum | $56,667 | $56,635 |
| Range | $43,279 | $44,184 |
| Mean | $30,568 | $33,796 |
| Median | $28,750 | $33,308 |
| Interquartile 25% (IQ1) | $24,607 | $29,977 |
| Interquartile 75% (IQ3) | $35,286 | $37,781 |
| Interquartile Range (IQR) | $10,679 | $7,803 |
| Standard Deviation (Sample) | $8,841 | $7,087 |
| Standard Deviation (Population) | $8,771 | $7,035 |
Demographics Similar to Danes and Immigrants from Laos by Median Female Earnings
In terms of median female earnings, the demographic groups most similar to Danes are White/Caucasian ($37,531, a difference of 0.53%), Colville ($37,514, a difference of 0.58%), Samoan ($37,498, a difference of 0.62%), Hawaiian ($37,497, a difference of 0.62%), and Belizean ($37,429, a difference of 0.80%). Similarly, the demographic groups most similar to Immigrants from Laos are Immigrants from Dominican Republic ($36,857, a difference of 0.040%), Nicaraguan ($36,904, a difference of 0.17%), French American Indian ($36,920, a difference of 0.21%), Immigrants from Venezuela ($37,003, a difference of 0.44%), and Cree ($37,018, a difference of 0.48%).
| Demographics | Rating | Rank | Median Female Earnings |
| Danes | 1.6 /100 | #253 | Tragic $37,730 |
| Whites/Caucasians | 1.1 /100 | #254 | Tragic $37,531 |
| Colville | 1.1 /100 | #255 | Tragic $37,514 |
| Samoans | 1.0 /100 | #256 | Tragic $37,498 |
| Hawaiians | 1.0 /100 | #257 | Tragic $37,497 |
| Belizeans | 0.9 /100 | #258 | Tragic $37,429 |
| Scotch-Irish | 0.8 /100 | #259 | Tragic $37,383 |
| Dutch | 0.7 /100 | #260 | Tragic $37,339 |
| Malaysians | 0.7 /100 | #261 | Tragic $37,298 |
| Venezuelans | 0.7 /100 | #262 | Tragic $37,282 |
| German Russians | 0.5 /100 | #263 | Tragic $37,105 |
| Salvadorans | 0.4 /100 | #264 | Tragic $37,083 |
| Immigrants | Belize | 0.4 /100 | #265 | Tragic $37,056 |
| Dominicans | 0.4 /100 | #266 | Tragic $37,046 |
| Immigrants | Nonimmigrants | 0.4 /100 | #267 | Tragic $37,024 |
| Cree | 0.4 /100 | #268 | Tragic $37,018 |
| Immigrants | Venezuela | 0.4 /100 | #269 | Tragic $37,003 |
| French American Indians | 0.3 /100 | #270 | Tragic $36,920 |
| Nicaraguans | 0.3 /100 | #271 | Tragic $36,904 |
| Immigrants | Dominican Republic | 0.3 /100 | #272 | Tragic $36,857 |
| Immigrants | Laos | 0.3 /100 | #273 | Tragic $36,841 |