Immigrants from North America vs Immigrants from Senegal Per Capita Income
COMPARE
Immigrants from North America
Immigrants from Senegal
Per Capita Income
Per Capita Income Comparison
Immigrants from North America
Immigrants from Senegal
$49,302
PER CAPITA INCOME
99.8/ 100
METRIC RATING
73rd/ 347
METRIC RANK
$41,830
PER CAPITA INCOME
11.3/ 100
METRIC RATING
212th/ 347
METRIC RANK
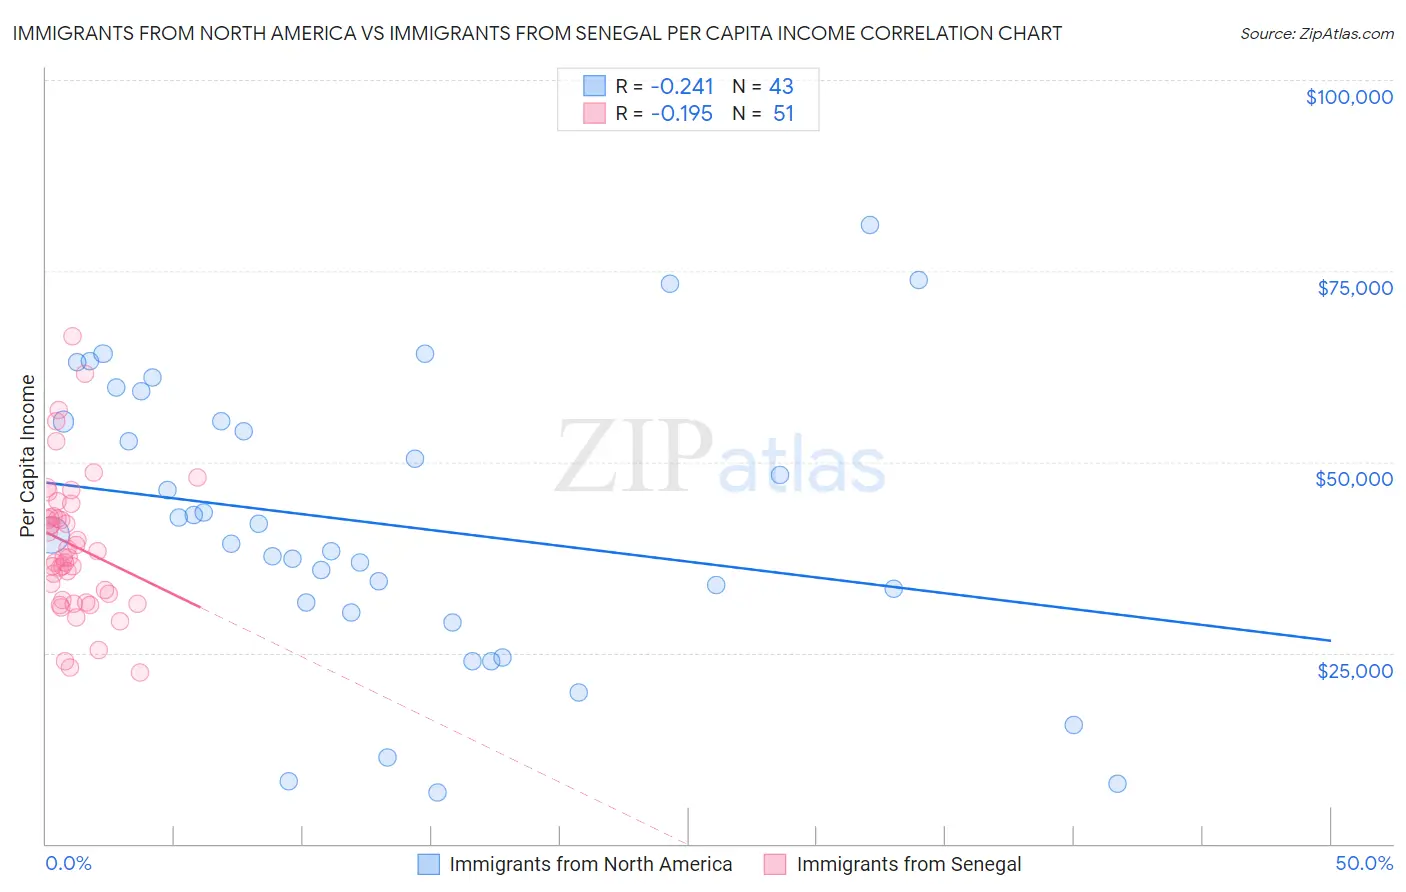
Immigrants from North America vs Immigrants from Senegal Per Capita Income Correlation Chart
The statistical analysis conducted on geographies consisting of 462,474,558 people shows a weak negative correlation between the proportion of Immigrants from North America and per capita income in the United States with a correlation coefficient (R) of -0.241 and weighted average of $49,302. Similarly, the statistical analysis conducted on geographies consisting of 90,129,295 people shows a poor negative correlation between the proportion of Immigrants from Senegal and per capita income in the United States with a correlation coefficient (R) of -0.195 and weighted average of $41,830, a difference of 17.9%.
Per Capita Income Correlation Summary
| Measurement | Immigrants from North America | Immigrants from Senegal |
| Minimum | $6,700 | $22,459 |
| Maximum | $80,940 | $66,378 |
| Range | $74,240 | $43,919 |
| Mean | $41,767 | $39,027 |
| Median | $40,404 | $37,536 |
| Interquartile 25% (IQ1) | $30,302 | $31,835 |
| Interquartile 75% (IQ3) | $55,294 | $42,907 |
| Interquartile Range (IQR) | $24,991 | $11,072 |
| Standard Deviation (Sample) | $18,582 | $9,175 |
| Standard Deviation (Population) | $18,365 | $9,085 |
Similar Demographics by Per Capita Income
Demographics Similar to Immigrants from North America by Per Capita Income
In terms of per capita income, the demographic groups most similar to Immigrants from North America are Immigrants from Hungary ($49,303, a difference of 0.0%), Greek ($49,309, a difference of 0.010%), Immigrants from Eastern Europe ($49,316, a difference of 0.030%), Immigrants from Canada ($49,412, a difference of 0.22%), and Mongolian ($49,173, a difference of 0.26%).
| Demographics | Rating | Rank | Per Capita Income |
| Immigrants | Bulgaria | 99.9 /100 | #66 | Exceptional $49,482 |
| Immigrants | Romania | 99.9 /100 | #67 | Exceptional $49,463 |
| Lithuanians | 99.8 /100 | #68 | Exceptional $49,448 |
| Immigrants | Canada | 99.8 /100 | #69 | Exceptional $49,412 |
| Immigrants | Eastern Europe | 99.8 /100 | #70 | Exceptional $49,316 |
| Greeks | 99.8 /100 | #71 | Exceptional $49,309 |
| Immigrants | Hungary | 99.8 /100 | #72 | Exceptional $49,303 |
| Immigrants | North America | 99.8 /100 | #73 | Exceptional $49,302 |
| Mongolians | 99.8 /100 | #74 | Exceptional $49,173 |
| Immigrants | Bolivia | 99.7 /100 | #75 | Exceptional $48,970 |
| Immigrants | England | 99.7 /100 | #76 | Exceptional $48,844 |
| Immigrants | Kazakhstan | 99.7 /100 | #77 | Exceptional $48,747 |
| Immigrants | Italy | 99.6 /100 | #78 | Exceptional $48,654 |
| Romanians | 99.5 /100 | #79 | Exceptional $48,445 |
| Egyptians | 99.5 /100 | #80 | Exceptional $48,358 |
Demographics Similar to Immigrants from Senegal by Per Capita Income
In terms of per capita income, the demographic groups most similar to Immigrants from Senegal are Immigrants from Panama ($41,853, a difference of 0.050%), Immigrants from Venezuela ($41,727, a difference of 0.25%), Immigrants from Bangladesh ($41,709, a difference of 0.29%), Ecuadorian ($41,958, a difference of 0.30%), and Sudanese ($41,695, a difference of 0.32%).
| Demographics | Rating | Rank | Per Capita Income |
| Whites/Caucasians | 15.9 /100 | #205 | Poor $42,180 |
| Ghanaians | 15.7 /100 | #206 | Poor $42,164 |
| Venezuelans | 14.4 /100 | #207 | Poor $42,074 |
| Panamanians | 13.9 /100 | #208 | Poor $42,035 |
| Immigrants | Sudan | 13.2 /100 | #209 | Poor $41,986 |
| Ecuadorians | 12.9 /100 | #210 | Poor $41,958 |
| Immigrants | Panama | 11.6 /100 | #211 | Poor $41,853 |
| Immigrants | Senegal | 11.3 /100 | #212 | Poor $41,830 |
| Immigrants | Venezuela | 10.2 /100 | #213 | Poor $41,727 |
| Immigrants | Bangladesh | 10.1 /100 | #214 | Poor $41,709 |
| Sudanese | 9.9 /100 | #215 | Tragic $41,695 |
| Tongans | 9.9 /100 | #216 | Tragic $41,693 |
| Guamanians/Chamorros | 9.7 /100 | #217 | Tragic $41,678 |
| Trinidadians and Tobagonians | 9.5 /100 | #218 | Tragic $41,655 |
| Puget Sound Salish | 8.1 /100 | #219 | Tragic $41,495 |