American vs Immigrants from Senegal No Schooling Completed
COMPARE
American
Immigrants from Senegal
No Schooling Completed
No Schooling Completed Comparison
Americans
Immigrants from Senegal
1.7%
NO SCHOOLING COMPLETED
99.8/ 100
METRIC RATING
60th/ 347
METRIC RANK
2.4%
NO SCHOOLING COMPLETED
1.7/ 100
METRIC RATING
240th/ 347
METRIC RANK
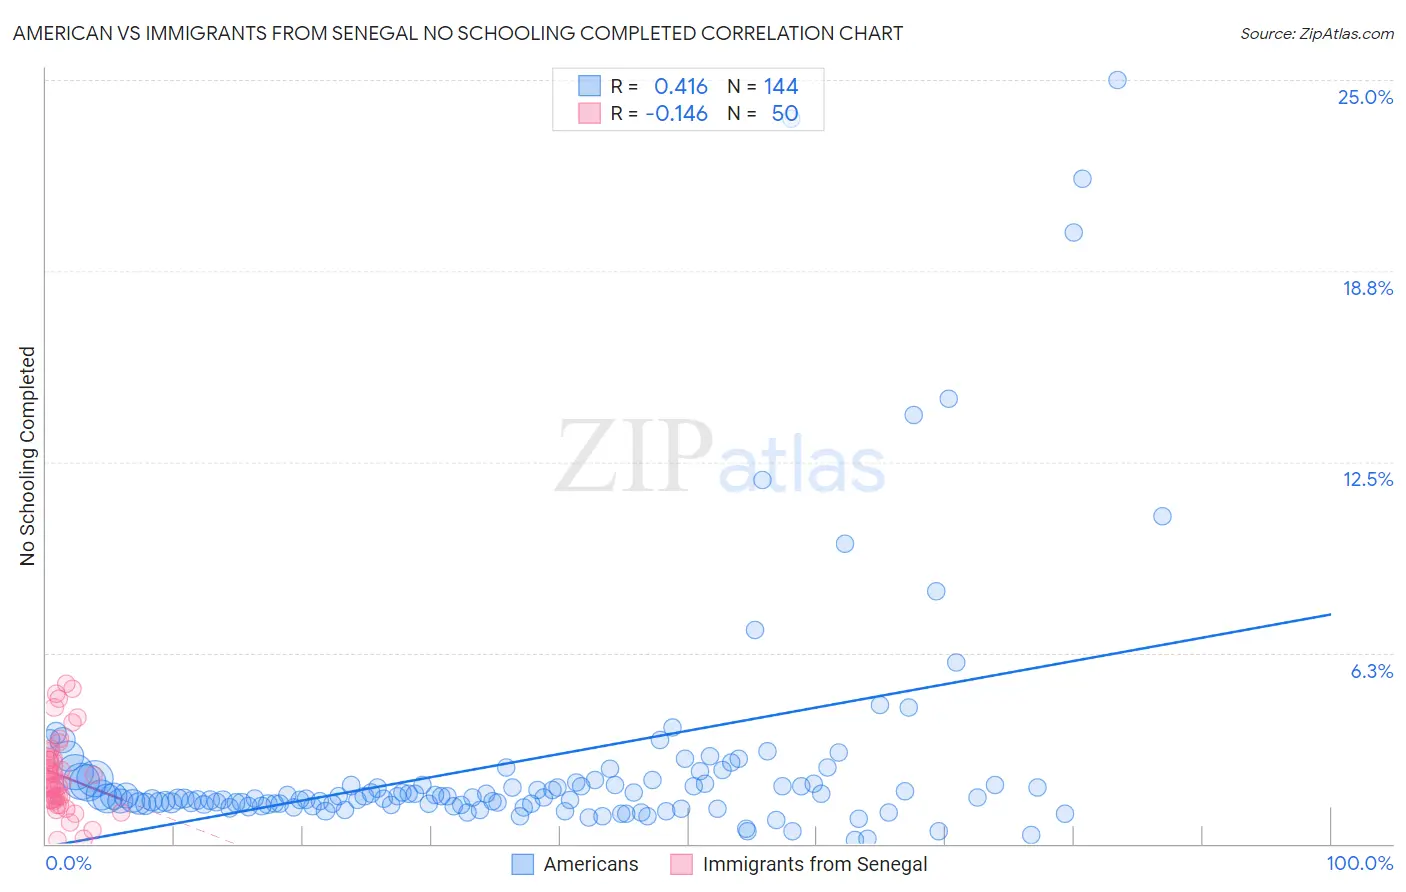
American vs Immigrants from Senegal No Schooling Completed Correlation Chart
The statistical analysis conducted on geographies consisting of 561,195,336 people shows a moderate positive correlation between the proportion of Americans and percentage of population with no schooling in the United States with a correlation coefficient (R) of 0.416 and weighted average of 1.7%. Similarly, the statistical analysis conducted on geographies consisting of 90,026,506 people shows a poor negative correlation between the proportion of Immigrants from Senegal and percentage of population with no schooling in the United States with a correlation coefficient (R) of -0.146 and weighted average of 2.4%, a difference of 43.8%.
No Schooling Completed Correlation Summary
| Measurement | American | Immigrants from Senegal |
| Minimum | 0.13% | 0.12% |
| Maximum | 25.0% | 5.2% |
| Range | 24.9% | 5.1% |
| Mean | 2.7% | 2.2% |
| Median | 1.5% | 2.0% |
| Interquartile 25% (IQ1) | 1.3% | 1.4% |
| Interquartile 75% (IQ3) | 2.0% | 2.8% |
| Interquartile Range (IQR) | 0.72% | 1.3% |
| Standard Deviation (Sample) | 4.1% | 1.2% |
| Standard Deviation (Population) | 4.0% | 1.2% |
Similar Demographics by No Schooling Completed
Demographics Similar to Americans by No Schooling Completed
In terms of no schooling completed, the demographic groups most similar to Americans are Slavic (1.7%, a difference of 0.12%), Kiowa (1.6%, a difference of 0.19%), Tsimshian (1.7%, a difference of 0.29%), Austrian (1.6%, a difference of 0.35%), and Greek (1.6%, a difference of 0.66%).
| Demographics | Rating | Rank | No Schooling Completed |
| Creek | 99.8 /100 | #53 | Exceptional 1.6% |
| Crow | 99.8 /100 | #54 | Exceptional 1.6% |
| Greeks | 99.8 /100 | #55 | Exceptional 1.6% |
| Immigrants | North America | 99.8 /100 | #56 | Exceptional 1.6% |
| Austrians | 99.8 /100 | #57 | Exceptional 1.6% |
| Kiowa | 99.8 /100 | #58 | Exceptional 1.6% |
| Slavs | 99.8 /100 | #59 | Exceptional 1.7% |
| Americans | 99.8 /100 | #60 | Exceptional 1.7% |
| Tsimshian | 99.8 /100 | #61 | Exceptional 1.7% |
| Immigrants | Northern Europe | 99.8 /100 | #62 | Exceptional 1.7% |
| Russians | 99.8 /100 | #63 | Exceptional 1.7% |
| New Zealanders | 99.7 /100 | #64 | Exceptional 1.7% |
| Serbians | 99.7 /100 | #65 | Exceptional 1.7% |
| Canadians | 99.7 /100 | #66 | Exceptional 1.7% |
| Immigrants | Austria | 99.7 /100 | #67 | Exceptional 1.7% |
Demographics Similar to Immigrants from Senegal by No Schooling Completed
In terms of no schooling completed, the demographic groups most similar to Immigrants from Senegal are Korean (2.4%, a difference of 0.060%), Liberian (2.4%, a difference of 0.23%), Paiute (2.4%, a difference of 0.35%), Immigrants from Indonesia (2.4%, a difference of 0.38%), and South American (2.4%, a difference of 0.42%).
| Demographics | Rating | Rank | No Schooling Completed |
| Immigrants | Malaysia | 2.8 /100 | #233 | Tragic 2.3% |
| Nigerians | 2.6 /100 | #234 | Tragic 2.3% |
| Immigrants | Western Asia | 2.6 /100 | #235 | Tragic 2.3% |
| Iraqis | 2.2 /100 | #236 | Tragic 2.4% |
| Immigrants | Eastern Asia | 2.0 /100 | #237 | Tragic 2.4% |
| Paiute | 1.9 /100 | #238 | Tragic 2.4% |
| Liberians | 1.8 /100 | #239 | Tragic 2.4% |
| Immigrants | Senegal | 1.7 /100 | #240 | Tragic 2.4% |
| Koreans | 1.7 /100 | #241 | Tragic 2.4% |
| Immigrants | Indonesia | 1.5 /100 | #242 | Tragic 2.4% |
| South Americans | 1.5 /100 | #243 | Tragic 2.4% |
| Peruvians | 1.4 /100 | #244 | Tragic 2.4% |
| Bolivians | 1.4 /100 | #245 | Tragic 2.4% |
| Immigrants | Congo | 1.4 /100 | #246 | Tragic 2.4% |
| Immigrants | Iraq | 1.3 /100 | #247 | Tragic 2.4% |